Sometimes, Everyone Agrees

I recently published a blog post arguing that over the next 5 years many commercial MMM engine developers might face an uncomfortable truth: their code and algorithms are not defensible. As part of that article, I separated the “MMM Vendor Value Prop” into four components:

  1. The core computational engine and algorithms (aka “engine and modeling capabilities”).
  2. A set of applications that use the trained model provided by the MMM to make recommendations (e.g., spend optimization and revenue forecasting).
  3. A structural model and set of data definitions.
  4. A set of integrations into data sources and production processes to run the engine and algorithms.

I then sketched out an argument that because the first two bullet points are very hard to defend, durable value will move “up the stack” into domain-and-vertical-specific intelligence, operational reliability, and ease of integration (into both other product-based components of the marketing stack and with internal toolchains and processes).

Here’s the actual statement:

The first claim I’m making is that open source will take over the first two bullet points. And the second claim I’m making is that, depending on company size, companies will either do the work associated to the last two bullet points themselves, or use an industry/vertical specific provider that leverages the open-source frameworks from the first two bullets (Larger companies will roll their own; smaller companies will use a vendor).

I also summarized that idea in a LinkedIn post with a buyer’s point-of-view question for MMM vendors: Why, concretely, is using their product a better idea than custom-coding a purpose-built solution on top of PyMC?

(using PyMC as a stand-in for open-source tooling).

To my mind, this is the key question that any vendor should be able to answer very concretely (and the answer should be on their website, in very concrete form).

Two MMM CEOs (Henry Innis (Mutinex) and Charles F. Manning (Kochava) ) disagreed publicly with the blog post. I’m genuinely happy they did. This industry needs more transparent debate, and both of their responses were professional, substantive, and worthwhile contributions to the conversation. I also want to say clearly: I respect Henry and Charles and nothing here is meant as a criticism of them or their teams.

Henry Innis’s Point: Incentives and Money Keep Vendors Ahead

Henry’s core disagreement is direct: he believes third-party MMM vendors are (and will remain) “far, far ahead” of open-source implementations (largely because commercial incentives fund product maturity).

Two specific points stood out:

  • The value is in the product around MMM, not the algorithm. Henry says most MMM value comes from solving product problems around the model, not from the modeling technique itself.

I think Henry and I are in complete agreement here.

  • AI may reduce the incentive to open source. He argues that many open-source efforts are sustained because they monetize elsewhere (implementation partnerships, customization, consulting, benchmarked data). If AI-assisted development reduces the “end state” that needs to be maintained, that value may shift into new SaaS surfaces rather than staying tied to open-source projects in their current form.

This second point is an interesting prediction in and of itself. Many open-source efforts will struggle in the years to come. An early sign of problems to come is the fact that Tailwind recently laid off 75% of their engineers.

In essence, Henry’s argument is that generative AI will cause open-source projects to falter, and commercial engines (funded by customer revenue) will be able to stay ahead.

This is a place where reasonable people can disagree. And, to be clear, I disagree with Henry: Corporate-backed open source , foundations, and vendor-adjacent ecosystems can sustain maintenance even if smaller OSS projects struggle.

Charles F. Manning’s Point: Trust is Built Outside the Engine

Charles’s response was about “trust and defensibility” – the key idea being that commercial MMM vendors, collectively, have established a basis for customer trust that enables them to defend their market (and that, because of this, the open-source engines will not get additional traction).

Using his numbering, the core of his argument is the following three objections:

  • Objection 3: Optimization is the Moat. In Charles’s view, the defensible layer is optimization: forecasting outcomes under constraints and balancing short-term performance with long-term value. He claims that commercial MMM optimization is sophisticated and delivers substantial enterprise value and that similar optimization layers don’t exist in typical open-source stacks today.

The disagreement Charles and I have is twofold. First, I am making a set of predictions about what will happen, and what will be true 5 years from now, and he’s talking about what exists in the market today (to some extent, we are talking about different things). For other points of view on the current state of open-source MMM, I recommend the discussions from Digiday, Search Engine Land, and EMarketer.

And, second, I simply don’t think optimizers and spend forecasters are defensible technologies.

  • Objection 4: Domain Expertise > Generic Modeling. Charles also emphasizes that domains like mobile advertising have unique constraints (attribution nuances, conversion lags, SKAdNetwork gaps, and so on). You can’t model what you don’t understand, and “generic MMM” will miss important real-world structure. Kochava’s product bakes in domain-specific intelligence based on more than a dozen years in the market.

I don’t think Charles and I disagree on this at all. This is actually a foundational thesis for Game Data Pros— effective optimization requires domain expertise and verticalization. A substantial part of the value-add is knowing what to do in a specific domain, not the core engine or modeling capabilities.

  • Objection 5: Modeling Code is not the Product. Charles states that “Model architecture is only ~10% of the challenge.” The rest is data reliability, validation, uplift testing, attribution reconciliation, and governance. These are the operational “scaffolding” that makes results defensible.

Here too, I think Charles and I are in complete agreement. And we both agree with Henry.

Charles concludes his response by saying:

 “Moving Up the Stack” Is What We Already Do. The article claims value will shift from algorithms to integration, QA, and scenario planning. That’s already our model. AIM is SaaS MMM built for action, not academic benchmarking. StationOne is next.

To which I can only say: Great. We are in total agreement.

Except, of course, that I think performance standards and benchmarks matter, and that the phrase “academic benchmarking” could be viewed as somewhat dismissive. Without performance standards and benchmarks, I don’t see how a customer can make an informed choice between the 50 or so providers in Marketing Science Today’s Provider map.

There’s a Lot of Common Ground Here

Henry and Charles’s objections align pretty closely with each other and with what I actually wrote.

  • Henry: the value is mostly in the product around MMM, and commercial incentives fund that product.
  • Charles: the moat is optimization, domain intelligence, reliability, QA, validation, integrations, governance (i.e., everything around the model and algorithms).

That’s extremely close to my claim that engines and algorithms are becoming commodities while value mostly becomes verticalized and domain-specific.

So, where’s the disagreement? I think it’s mostly about what “open source replaces” actually means.

When I say open source “replaces” commercial MMM implementations, I don’t mean the world stops buying (or leasing) MMM engines in the short-term. I mean that the core modeling and optimization stack will be increasingly based on open source, and that, over time, we will have open baseline implementations (increasingly good, increasingly automated).

Faced with that, some commercial vendors will continue to develop their engines. But most will try to win by layering value on top of open source platforms (and not by asking customers to trust a proprietary system without independent evidence).

In much the same way that 60% of developers build on PostgreSQL, I would be willing to bet that, in 5 years’ time, 80% of new MMMs will be built on an open-source framework.

About Benchmarks and Test Suites

In a separate LinkedIn post, I praised Mutinex for building an open-source framework for evaluating MMMs and publishing “rough benchmarks” for what good performance looks like. We can argue about whether they chose the right metrics, and whether or not their performance thresholds are the right ones, but I love the fact that they jump-started a conversation about what metrics and performance.

  • MAPE / sMAPE: excellent <5%, good 5–10%, acceptable 10–15%, poor >15%
  • R²: excellent >0.9, good 0.8–0.9, acceptable 0.6–0.8, poor <0.6
  • Stability & sanity checks: parameter change, perturbation change, and placebo ROI bands

Even more commendably, Henry publicly praised Recast for pioneering the public discussion of MMM performance. And he was right to do so: Recast’s Accuracy Dashboards, discussion of their model validation process, and how to do back testing are exemplary.

Simply put, if we think MMMs are a critical part of the marketing infrastructure, and we think there are substantial performance differences between them, then we ought to be able to define objective performance standards and metrics, and then compare different MMMs using publicly available test suites in exactly the same way that people compare databases.

What we shouldn’t do is claim that the open-source frameworks (or our competitors) aren’t very good, but not have a public test suite or standardized definitions of what good means.

The Path Forward is Open Source and Test Suites

My original article was long (~4,000 words). Here’s a simplified form of the predictions.

  • The modeling and optimization core will become mostly open. I don’t see any reason to recant (any of) the predictions. The trajectory is the same: better libraries, better tooling, and (with AI) faster iteration and adoption.
  • Without a shared test suite and standards of accuracy, open source will win “the engine wars” by default. Without hard evidence, customers have no objective reason to believe a specific proprietary engine is better, and plenty of reasons to prefer an open implementation. And because, over time, for the reasons outlined in the original article, the open-source implementations will pull ahead and become the defaults engines which get plugged into enterprise marketing architectures.
  • Vendors will differentiate above the core. Domain-specific models, priors, and constraints, automated QA, data pipelines, experimentation and uplift integration, governance, and workflow UX are all important pieces of an overall marketing architecture, and they’re the place where differentiation and value creation will happen.

In an upcoming article, I’m going to focus on the second of these bullet points and write more about what credible MMM engine validation should look like (and what a public test harness could include).

But for now, I’m just happy we’re all talking about this in public.

9 Overlapping Predictions That, Collectively, Explain Why Open Source Will Mostly Replace Commercial MMM Implementations Sometime in the Next Five Years

At various points in the past year (at the 2025 Game Revenue Optimization Mini-Summit and, more recently, on LinkedIn), I’ve been an advocate for a take that makes some people uncomfortable:

Open Source is Going to Dominate the Future of Commercial MMM.

When I say that in private conversations, I usually get one of two flavors of pushback.

  1. “Sounds like a big change. What do you mean by dominate?”
  2. “You do game revenue optimization for a living — talking about the future of MMM isn’t exactly in your swim lane. Why do you care?”

The second question is easy. In mobile games, marketing measurement isn’t an analytics side quest — it’s part of the core loop. If you can’t measure incrementality, you can’t compute marginal Return on Advertising Spend (ROAS) or forecast payback. If you can’t compute marginal ROAS or forecast payback, you can’t scale. And since GDP occasionally gets retained to help evaluate user attribution and marketing measurement systems and build roadmaps, our customer base is effectively saying: “Yes, GDP, this is precisely your swim lane.”

The first question is harder, because “open source will dominate” is imprecise and implies a significant change in the market. Let’s start by defining dominate.

By dominate, I mean the default foundation for serious MMM implementations will be open-source frameworks like Meridian or PyMC and that most commercial value will move up-the-stack into integration, operations, governance, and domain-specific modeling.

How will this happen? The rest of this article contains a set of predictions for how the commercial landscape of MMM technology will evolve over the next 3–7 years (and why I think that the excellent provider maps from Marketing Science Today are going to change dramatically as a result).

Marketing Science Todays MMM Provider Map.
MMM Provider Map from https://marketingscience.today/

This article is formulated as a set of nine specific predictions that, collectively, justify the claim that open source is going to dominate the future of MMM.

Before we get started, it’s important to note that, conceptually, an “MMM implementation” divides into four pieces:

  • The core computational engine and algorithms (aka “engine and modeling capabilities”). This is the hard data science code and is also commonly referred to using the following names: model layer, inference engine, and model training engine.
  • A set of applications that use the trained model provided by the MMM to make recommendations (e.g., spend optimization and revenue forecasting).
  • A structural model and set of data definitions. This is the data-modeling part of the job and is also commonly referred to by the following names: model structural form, measurement framework, data and metrics taxonomy, schema & definitions, or semantic model.
  • A set of integrations into data sources and production processes to run the engine / algorithms.

The first claim I’m making is that open source will take over the first two bullet points. And the second claim I’m making is that, depending on company size, companies will either do the work associated to the last two bullet points themselves, or use an industry/vertical specific provider that leverages the open-source frameworks from the first two bullets (Larger companies will roll their own; smaller companies will use a vendor).

And, of course, if you’re the sort of person who likes their predictions laced with some empirical validation, everything I’m talking about in this article is already happening (per William Gibson, the future is already here. It’s just not evenly distributed).

Here, for example, is a recent post from LinkedIn:

MMM vendors are increasingly losing deals to the open source platforms.
Source: https://www.linkedin.com/feed/update/urn:li:activity:7407778595366125568/

With that said, let’s get started.

Prediction #1: No Private Vendor Will Maintain a Durable “Engine and Modeling Capabilities” Edge Over Open Source Frameworks

If you’ve worked in software long enough, you know how this goes.

A core technology becomes strategically important and broadly applicable. Open-source communities form. Enterprises start contributing. Vendors stop competing on the core algorithms and software capabilities, and start competing on packaging, workflow, and services.

And here are three examples from recent history:

MMM is lined up for the same pattern because it has the same properties as databases, operating systems, and orchestration frameworks. That is, it has:

  • High strategic value. Being able to optimize advertising spend is mission-critical for most companies.
  • Low “technical secret sauce.” MMM has sixty years of academic research behind it and the core ideas are well-understood. The core ideas have been refined, and re-refined, and most MMM engines have easily understood structural models.
  • MMM is not core competence. For most companies, MMM is an analytical tool that helps them allocate advertising spend more effectively. From a business perspective, the real differentiation is elsewhere (product, brand, …).
  • A constant need to evolve in response to platforms changes. In fact, the modern resurgence of MMM, at least in some verticals, dates back to Apple’s decision to change privacy rules (for the current rules on iOS, see Apple’s ATT docs and Apple’s SKAdnetwork docs)
  • A shared problem structure across companies. This will be revisited more extensively below in Prediction #6. For now, suffice it to say that two educational software companies that ship mobile apps and charge a subscription are very likely to have similar MMMs implementations, and there is little or no point to them investing in building the underlying technology.
  • A huge premium on transparency and trust. In many ways, this is part of “high strategic value.” If a tool is being used to make important decisions, it needs to have a high level of transparency and trust. And MMM is especially vulnerable to open-source standardization because the trust surface area is huge: inputs, priors, assumptions, diagnostics, and decomposition logic all need to be inspectable.

The first three of these argue that companies will outsource development of MMM technology. The last two imply that if your commercial moat is “our engine and algorithms are better but we can’t tell you why because trade-secret,” you might run into problems as the market matures.

Prediction #2: Most Major Companies Will Run Internal MMM Systems On Top of an Open-Source Codebase

The first part of this prediction centers around the following question here: at scale (say, $100M in annual media spend), should a company rely on an MMM run by an MMM vendor? The answer is that, for many brands, this doesn’t make sense. Instead, most large-scale advertisers should and will run and maintain MMM systems internally, even as they lean on external experts for initial setup and periodic checkups.

Why? Because at a certain scale, the MMM isn’t a model or an algorithm or a separate piece of software. It’s part of a much larger system comprised of

  • Data contracts with a large number of other marketing systems.
  • Features engineered on top of proprietary data (which, in many cases, cannot be shared or has to be scrubbed extensively before sharing for compliance reasons).
  • Integrated experimentation layers.
  • Stakeholder workflows, customized dashboards, and integrations to internal planning and financial systems.
  • Repeatable forecasting routines.

All of this is incorporated into an internal suite of truth, and is tied to mission-critical, highly visible, processes that are often company specific (that is, the decision to bring the MMM in-house mostly means owning the data contracts, the refresh cadence, governance, experiment and integration, …. not re-inventing Bayesian inference).

And once a company decides to use an internal system, the decision to leverage robust open-source framework is an easy one to make.

This trend is already visible. Google’s Meridian is explicitly positioned as enabling advertisers to run in-house MMM. And Meta’s Robyn was built for “in-house and DIY modelers,” with published case studies including in-house applications.

Robyn’s documentation is clear: the goal is to support in-house modeling.
(Taken from https://facebookexperimental.github.io/Robyn/docs/analysts-guide-to-MMM/)

The interesting second-order effect is contribution. Once enough big companies run open-source MMMs in production, they’ll start contributing code and fixes back. Not out of charity, but because maintaining private forks is expensive and they want the ecosystem to solve shared problems in standard ways (like clean room inputs, reach/frequency handling, calibration tooling, and standardized diagnostics).

That flywheel is why open source solutions tend to accelerate once they reach critical mass (and it’s also why private solutions, once they fall behind, never catch up). And accelerating flywheels lead to dominant solutions.

Prediction #3: The Two “Leading Open-Source Bayesian MMMs” Will Become Fundamentally Different Systems Over Time

Right now, the two Bayesian open-source platforms that are leading the conversation are Google’s Meridian and PyMC-Marketing’s MMM.

They’re both Bayesian. They’re both open source. But they don’t feel like the same product at all.

(If you want a deeper comparison, there are already multiple comparisons floating around, including a head-to-head benchmark from PyMC Labs and some excellent practitioner writeups. See, for example, this comparison from early 2025 or this pair of articles from PyMC)

My take is simple:

  • If you’re resource constrained and need a tighter “path to value,” Meridian’s ease of use is a very nice feature. Both Google and the community will lean into that, making MMM easily accessible to a large number of lightly-resourced companies.
  • If you have strong internal modeling expertise and you need to build something bespoke (hierarchical, multi-outcome, time-varying, experiment-informed coefficients, …), PyMC-Marketing is the more extensible base. And PyMC will lean into that, in the process becoming the enterprise toolkit for MMM.
  • This gap will widen over time because Meridian will optimize for adoption and repeatability, while PyMC will optimize for extensibility and enterprise-grade composability.

Of course, these first three predictions are the backbone of the prediction everyone wants to argue about.

Prediction #4: By 2030, Many Enterprises Will Run “Open-Source MMM / In-House Team / Ecosystem Contributions”

Today, most enterprise MMM “systems” are still a patchwork of legacy martech tools, bespoke SQL, and spreadsheet glue—refreshed quarterly or semi-annually and dependent on a few heroic analysts. That’s why this shift will feel less like “switching models” and more like infrastructure modernization: once the core technology is standardized, the real work becomes building durable data contracts, QA, governance, and decision workflows around it.

The general pattern is the same one we’ve seen elsewhere:

  • MMM is becoming infrastructure.
  • Infrastructure gets standardized.
  • Standardization favors open source.
  • Enterprises keep control of the instance, the data, and the business logic.

The best mental model here is Kubernetes. Kubernetes won not because one vendor stayed ahead forever, but because it became the standard substrate that everyone extended: cloud providers, security tooling, observability, deployment pipelines, and internal platform teams. MMM is headed toward the same kind of ecosystem. Once a handful of large advertisers operationalize open-source MMM, you’ll see an explosion of “everything around the model”: data connectors, calibration pipelines, scenario tooling, automated QA, governance, and decision workflows.

And this is where contributions become inevitable. In practice, “contributing back” won’t look like brands publishing their spend curves or revealing confidential information. It will look like bug fixes, stability improvements, new diagnostics, better infrastructure for priors, standardized data schemas, and reference implementations for common patterns (geo hierarchies, reach/frequency, promotions, creative fatigue). Those are the shared problems that everyone wants solved once and then maintained by the community.

So, the MMM vendor category doesn’t disappear. Instead, it moves up-the-stack, from “owning the engine” to “owning deployment, governance, integrations, and vertical packaging.”

Prediction #5: Most Providers in the “MMM Platform Map” Will Be Forced to Pivot (Or Become Commoditized)

If you look at provider maps like the one above from Marketing Science Today, you’re basically looking at a snapshot of a market where most of the enterprise value is currently held by:

  • Proprietary implementations.
  • Bespoke onboarding and integrations.
  • Customer lock-in.
  • Opaque modeling decisions that are hard to replicate.

Once the open-source substrate becomes standard, a substantial percentage of that value simply evaporates.

Which Vendors Will Survive?
AI-Generated MMM Provider Map Circa 2030

Some vendors will still win—not by owning the engines and algorithms, but by owning integrations into clean rooms and walled gardens, governance/model risk tooling, change management, and the operational layer that makes MMM usable week-to-week.

MMM consultants will continue to prosper by offering specialized services (in much the same way that Percona helps companies get the most out of their open-source databases). Enterprises will have internal MMM teams that know the business deeply. They’ll still need help with the initial development of their MMM, and specialist help when things go south in a complicated way.

And some companies will offer “MMM as a service” on top of the open-source platforms. I expect that the way this will roll out is that a company will develop deep expertise in a specific vertical (see the next prediction), and operate and maintain the MMM in production for smaller companies (that don’t want to have expertise in keeping an MMM running). Note that these will be relatively thin layers on top of open-source frameworks.

What won’t prosper is proprietary engines or algorithmic / data-science code.

Prediction #6: Verticalized MMM Becomes a Real Category (And It Will Look Like “Open-Source / Hosting / Domain Expertise”)

Here’s the (slightly) exaggerated version of an important claim:

Companies in the same vertical need the same MMM (in everything except the data. And mostly the same data too)

This is not a new insight. In 2005, in an article entitled Market Response Models and Marketing Practice Hanssens, Leeflang and Wittink talked about “standardized models” and “the availability of empirical generalizations.” And in 2009, in an article entitled Market Response and Marketing Mix Models:
Trends and Research Opportunities
, Bowman and Gatignon explicitly talked about “Industry Specific Contexts.” Newer work and meta-analyses show that response patterns can be meaningfully different in specific sectors (e.g., entertainment), limiting naïve transferability and strengthening the case for vertical-specific defaults, priors, and diagnostics.

To make this more concrete, consider the following verticals:

  • Subscription digital goods (streaming, SaaS-ish consumer apps, memberships). Focus: long payback windows and retention-driven growth. Core issues: linking media to CAC/LTV, cohort behavior, and delayed revenue realization (making outcome measurement unreliable).
  • Mobile video games / live-service games. Focus: both acquisition and re-engagement, with marketing organized around strong content beats. Core issues: mixed performance + brand dynamics, event-driven baselines, platform signal loss, overlapping measurement systems, creative fatigue, and the need for high-frequency (daily/weekly) budget adjustments.
  • DTC e-commerce for physical goods. Focus: heavy paid social/search, promotion calendars, and operating within inventory constraints. Core issues: major confounders from merchandising/pricing/promo strategy, and separating media effects from cultural events and seasonality (e.g., holidays).
  • Omnichannel retail (brands with physical stores and online commerce). Focus: coordinating a wide mix of legacy and digital media across multiple purchase paths. Core issues: inconsistent measurement units (e.g., GRPs vs. impressions), geo/store hierarchies, distribution changes, attributing media to footfall vs. online activity, and disentangling holiday-driven demand from true incrementality.
  • QSR / food delivery (fast food, restaurants with delivery, delivery aggregators). Focus: local demand generation with always-on promotion strategies, increasingly tied to digital outcomes (e.g., app installs, online orders). Core issues: localized dynamics, promo-driven demand shifts, weather sensitivity, competitive pressure, and multi-outcome measurement across in-store and digital channels.
  • Healthcare services / providers (health systems, urgent care, dental/ortho, telehealth). Focus: high-consideration decisions with conversions that often occur offline (calls, intake, scheduling) and vary heavily by geography. Core issues: multiple outcomes (inquiries, appointments, treatments, and revenue), long and variable lags in ad response, capacity constraints (clinician supply and scheduling), compliance concerns, and confounders like payer mix/open enrollment cycles, network changes, local competition, and seasonal demand shocks.
  • … (feel free to add Education, Insurance, … )

Each of these verticals is clearly distinct from the others (the requirements for digital subscription goods are very different from those for healthcare), and each is ripe for a standardized model and SaaS services built on top of hosted open source.

That is, companies in a single vertical aren’t identical, but they are similar enough that you can build a single verticalized MMM system. Such a system would have:

  • A canonical data model / structural form.
  • A set of priors and response curve defaults.
  • A standard set of confounders.
  • A standard set of integrations to vertical-specific tools.
  • And a standard reporting workflow.

Note also that building this, in the open-source world, requires deep domain expertise, and just-enough MMM expertise to encode the right confounders and workflows (but not the kind of research-grade modeling and coding effort required to build the core framework). In other words, this is best done as a layer on top of the open-source MMM toolkits that are already available.

I also expect that many of these companies will actually be “spun-out” from companies already doing business in the vertical (in the same way that Discord began life as the communication layer of Fates Forever).

The prediction is that the open-source community will build and maintain the hard data-science parts, as both out of the box systems and as extensible toolkits, and the vertical-specific hosting companies will build and maintain the domain specific models (and compete on domain expertise, not MMM expertise)

Prediction #7: After Vigorous Debate, the Industry Will Converge on What “Accurate MMM” Means (And It Won’t Be a Single Number)

Right now, the idea of “accuracy” is a mess. Two different groups of people, or two different MMM providers, can both say “our MMM is highly accurate” and mean completely different things. For example, they could mean:

  • The model has high R² (or RMSE. Or NRMSE, NMAE, …)
  • The model has good out-of-sample prediction error (e.g., using one of RMSE / MAPE / wMAPE / sMAPE / MASE, NRMSE, NMAE, …)
  • The model backtests well.
  • The model matches lift test and incrementality tests.
  • When we run the MCMC sampler again, we get the same results (note that we’re not including sampler metrics, like BFMI, in this list because they matter for reliability, whether we can trust the outcome of the sampler, but aren’t about accuracy).
  • The results are stable under time-series cross-validation.
  • The decomposition looks plausible to domain experts.

In order to progress, the industry has to move toward a layered standard that looks like:

  1. Predictive sanity checks (R², RMSE, MAPE, wMAPE, etc.) with vertical-specific values for “good” and “great” performance (e.g., a 10% wMAPE is probably excellent in omnichannel retail, but not nearly as impressive in subscription digital goods).
  2. Stability checks (time-slice CV, holdouts, parameter stability)
  3. Decomposition plausibility (no insane baselines, response curves make sense to industry experts, and so on)
  4. Calibration / validation against experiments (geo lift, conversion lift, interrupted time-series analysis)

Note that everyone is starting to talk about accuracy and performance measurements more seriously. Meridian’s documentation explicitly states the goal is causal inference, and that out-of-sample prediction metrics are useful guardrails but shouldn’t be the primary way fit is assessed. Similarly, PyMC-Marketing explicitly documents evaluation workflows and time-slice CV, including Bayesian scoring like CRPS and Recast has been a staunch advocate for stability and robustness.

The consensus will be less like “everyone uses metric X” and more like “everyone uses a shared evaluation playbook which is customized by vertical.”

Prediction #8: “Interoperability in the Marketing Stack” Will Stop Meaning “Everything has a Dashboard”

Today, most marketing systems are tied together at the dashboard level. System A produces a chart. System B produces another chart. A smart human stares at both charts and then decides what to do.

That’s not interoperability in any real sense. That’s parallel usage (possibly accompanied by “storing the data in the same relational database”)

In the next iteration of marketing measurement, interoperability will mean:

  • Shared metric definitions.
  • Shared data sets.
  • Machine-readable outputs.
  • And automated decision workflows (with humans supervising, not translating).

AI is going to accelerate this, not because LLMs magically fix data, but because they dramatically reduce integration friction.

Protocols like MCP (Model Context Protocol) are basically “standard tool interfaces for AI systems,” and they’re already being applied to analytics. AI tools enable companies to deal with messy and unstructured data and dramatically lower the barriers to system integrations. Ad Exchanger recently published a nice summary of the value of MCP but the key point is simply this: the adoption of MCP is spreading rapidly (for example, Google ships a Google Analytics MCP server so an LLM can connect to GA4 data directly, you can manage your Facebook ads via MCP, analytics vendors like Mixpanel have adopted MCP, and so on). Once MMM outputs and measurement systems are exposed through standard interfaces, LLM-driven agents can:

  • Map schemas across platforms
  • Translate metric definitions
  • Generate and maintain transformation code
  • And reconcile “same concept / different naming” problems that currently require senior analysts and significant amounts of tribal folklore.

This is the tedious plumbing work that marketing stacks have always needed… and never staffed adequately. And now it’s, if not easy, doable.

Prediction #9: Standardization Creates Shareable Datasets, Enabling Academic Research that Will Accelerate Model Progress

In the long run, standardization creates three things (that don’t exist today at scale):

  1. Benchmark datasets (mostly synthetic and semi-synthetic) with known ground truth as well as standard definitions for metrics and data elements.
  2. A shared evaluation suite (the “accuracy playbook” from Prediction #7, but runnable as code).
  3. Privacy-safe collaboration patterns that let companies share researchable artifacts without sharing raw sensitive data.

Once those exist, academics can stop doing “MMM research in the void” and start iterating against problems that look like production.

There are already efforts aimed at connecting academics, advertisers, and vendors around MMM research (e.g., industry initiatives convening multiple stakeholders). The next step will be a shared evaluation suite — not just “use RMSE,” but a versioned set of tests that any MMM implementation can run: rolling time-slice CV, stability checks, decomposition plausibility checks, calibration scoring against experiments, and distributional scoring where appropriate.

In other words: an MMM will be able to pass or fail a standardized battery of tests the way software passes unit tests.

Once the community has that, we get something we’ve never had: comparability. Practitioners can argue about assumptions instead of arguing about whose dashboard looks nicer. Vendors can compete on reliability and usability. And researchers can publish results that actually translate back into practice because everyone can reproduce them.

Did I Make a Mistake? Surely the Future Isn’t This Predictable

This article contains 9 fairly specific predictions about the future of MMM. Each of the predictions is plausible and reasonably well-supported (I could add more supporting details, but we’re already at almost 4,000 words).

If I’ve done my job well, you agree with six or seven of the predictions and have reservations about two or three of them. But you’re probably still on the fence about whether the MMM provider community is about to implode as their customer base standardizes on top of open-source MMM frameworks.

That’s okay. The goal was to start a conversation.

The point of view here is that we are in the “suddenly” part of the famous Hemingway quote.

“Gradually, and then suddenly” — Hemingway was talking about going bankrupt, but the quote applies to almost every major change. Things start slow and then accelerate.

But timing is hard.  Bill Gates might very well wind up with the last word. “We always overestimate the change that will occur in the next two years and underestimate the change that will occur in the next ten.”

If Your Incrementality Model Is “Better,” Ship the Test Suite

(AKA Why “Trust Us, It’s Better” Is the Wrong Way to Ship Measurement Algorithms)

A new algorithm just dropped in the marketing measurement ecosystem.

And I had a very mixed reaction.

On one hand: Heck Yeah. I love seeing teams invest in making geo-testing and incrementality analysis more reliable. This stuff is hard. The world is noisy. Decision-makers want something actionable, not an uncertainty interval that’s wider than a barn door.

On the other hand: Sigh. the announcement was basically “we built a new thing, it’s better than the open source equivalents, trust us.” The claim is that it produces less biased estimates, narrower intervals, and better calibration. But without sharing much about the method or the test suite that backs those claims up.

I’m excited about innovations in incrementality. I’m less excited about black-box measurement claims—especially when teams and budgets depend on them.

Why I care (and why this keeps coming up)

For context: GDP sometimes does UA benchmarking and measurement diagnostics—assessing a customer’s current setup (MMM, incrementality, vendor stack), and then giving them a roadmap for improvement.

These engagements usually include some form of vendor analysis (e.g. helping our customers make build vs buy decisions). And in my experience, a meaningful fraction of MMM / incrementality vendors do not share technical details about how their models work.

That usually triggers three red flags for me:

  1. One evolutionary (the “Bill Joy” problem)
  2. One practical (the “don’t grade your own homework” problem)
  3. One ideological (the “measurement is a shared scientific inheritance” problem)

Let’s talk through them.

Red Flag #1: The World Will Out-Innovate You (aka Joy’s Law + Open Innovation)

Bill Joy’s famous line is:

“No matter who you are, most of the smartest people work for someone else.”

A straightforward consequence of Joy’s law is that most innovation happens elsewhere. And that your job, as a company, should include systematically surveying and learning from the wider ecosystem (as a side-note, it’s not a coincidence that Bill Joy’s work on Unix was a key enabler of the open-source revolution).

The academic literature goes one step further: you should not only systematically survey and learn from the wider ecosystem. You should also give back. Knowledge-sharing can be a rational, value-creating strategy, because it attracts external effort and converts it into your advantage. Here’s two important papers on this subject:

  • Lerner & Tirole’s economics work explains how open source participation can be motivated by things like career concerns and reputation—and why that’s not just altruism.
  • Their later synthesis makes the case that a lot of open source dynamics are explainable using standard economics (theories of labor and industrial organization), i.e., it’s not “vibes,” it’s incentives.

Note also that firms don’t necessarily have to go “fully open.” There’s a well-studied middle ground: selective revealing. Joachim Henkel’s work on embedded Linux describes firms revealing selectively—sharing meaningful chunks of firm-developed innovation to get external support and ecosystem benefits, while still protecting some competitive IP.

In a later paper, Henkel, Schöberl, and Alexy go further: they describe how customer demand for openness can trigger a positive feedback loop, and eventually openness becomes a new dimension of competition.

That last sentence is the key: once open-source takes hold, and once openness becomes competitive, “closed by default” becomes an evolutionary dead-end. Which means that when a vendor, any vendor, announces a new algorithm but won’t disclose method details or evaluation infrastructure, in an area where there is a credible and growing open-source presence, my spidey-sense starts to tingle. Is this actually an improvement on the state of the art? And, even if it is, is it about to get obsoleted by the open ecosystem?

This question matters a lot because switching costs are real. How can I recommend a vendor to my customers if I suspect that their systems are going to become obsolete in short order?

Red Flag #2: Don’t Grade Your Own Homework (Especially in Measurement)

The second pragmatic red flag is simpler:

When a vendor is the only one who can evaluate the vendor’s product, we’re doing marketing and not science.

A black-box algorithm and a proprietary test suite and self-reported “we’re better” claims is very hard to assess responsibly (especially if, like GDP, you’re advising customers and their budgets). And while a potential customer could, in theory, use a free-trial period to do the comparison themselves, most customers don’t have the ability to do that (and especially don’t have the ability to do that across a suite of potential vendors). Not to mention that having every potential customer do a bakeoff against a suite of vendors is monumentally inefficient.

Acknowledging the importance of verification is a great starting point. But it’s almost meaningless if the details of the verification aren’t fully available.

The PyMC case study: a rare “this is how you do it” moment

This is why I was genuinely happy to see the PyMC Labs team publish an apples-to-apples MMM benchmark comparing PyMC‑Marketing and Google’s Meridian.

What they did right:

  • They explicitly set out to create and publish a rigorous technical benchmark on realistic synthetic datasets covering different scales (from “startup” to “enterprise”).
  • They aligned model structures and used identical priors and sampling configurations to keep it fair.
  • They held a webinar and then published a video walking through the comparison.
  • They made the benchmark code publicly available on GitHub for reproducibility. The repo itself is not just a toy notebook. It’s a benchmarking suite with data generation and parameter recovery tooling, and it explicitly supports comparing inference methods/libraries.

Even if you disagree with their modeling choices, you can do something extremely powerful:

You can argue with the algorithms and the code instead of arguing with the vibes.

Nico Neumann deserves a special callout here. His LinkedIn post about the PyMC <-> Meridian comparison generated one of the most informative LinkedIn threads in recent memory.

That’s how a field levels up. And it’s the ecosystem pattern I’d love incrementality vendors to lean into more often:

  • Publish methodology details
  • Publish test suites
  • Publish failure modes
  • And compete on product + implementation + support, not secrecy

Red Flag #3: Measurement is a Shared Scientific Inheritance (and Secrecy Slows the Whole Genre)

Here’s the more ideological point:

MMM and incrementality aren’t new. These tools are built on decades of rigorous academic work, plus a growing body of open-source implementations:

We are all building on shared foundations. And when vendors keep core methodology opaque, the science progresses slower, trust erodes faster, and customers lose confidence more easily.

Integrating Experimentation into Marketing Measurement

Table of Contents

Introduction

Understanding advertising effectiveness is crucial for any marketing strategy because it directly impacts resource allocation, campaign optimization, and overall return on investment (ROI). By measuring how well advertisements perform, marketers can determine which messages resonate with their target audience, identify underperforming channels, and refine their creative approach to boost engagement. Effective ad analysis also helps pinpoint the ideal balance between reach, frequency, and targeting precision, ensuring that budgets are not wasted on ads that fail to drive revenue. Moreover, it provides valuable insights into consumer behavior, helping businesses adjust to changing preferences and trends. Ultimately, understanding ad effectiveness enables data-driven decision-making, empowering marketers to create more impactful campaigns that achieve measurable outcomes and foster long-term brand growth.

Integrating experimentation into marketing measurement is one of the most effective ways to achieve advertising effectiveness. You can optimize resource allocation and improve ROI by embedding controlled experiments, such as AB tests or randomized controlled trials (RCTs), into your marketing processes and analytics. In a recent study, those advertisers on an online advertising platform who used ad experiments for measurement saw substantially higher performance than those who did not. An e-commerce advertiser running 15 experiments (versus none) saw about 30% higher ad performance in the same year and 45% in the year after. While this evidence is correlational, it’s reasonable to assume that, in today’s data-driven landscape, experimentation, personalization, and automation are not just a best practice; they are becoming a competitive necessity.

However, integrating an experimentation strategy into marketing measurement can be complex, often requiring large-scale organizational changes and careful planning. This means clearly articulating objectives, establishing a hierarchy for measurement and analytics, selecting the right types of metrics, and determining a system of ground truths and methodologies. You must decide on your marketing and business goals, such as prioritizing ROI or top-line growth. By clearly understanding these goals, you can more effectively design experiments and integrate these with observational analytics to refine your strategies. This ensures that the integration of experimentation is not just a technical procedure but a crucial part of a larger, comprehensive strategy to achieve business success.

In this article, we provide high-level guidance on how you can succeed with integrating experimentation into your marketing measurement.

Why Experimentation is Necessary

In the 20th century, the field of marketing experienced a dramatic transformation driven by advancements in data collection, analytics, and communication technologies. Early in the century, marketing effectiveness was primarily assessed through anecdotal evidence and crude measures, such as sales increases and consumer feedback. The rise of mass media—newspapers, radio, and television—ushered in an era of broad audience outreach, leading to the development of audience metrics such as radio ratings and TV viewership statistics. The mid-century saw a growing interest in market research, with the establishment of industry giants like Nielsen providing quantitative insights into consumer behavior.

By the late 20th century, computers had revolutionized data analysis, enabling sophisticated consumer segmentation and predictive modeling. It became common practice to use econometric models to determine the relationship between the various factors in a marketing model.  In particular, the field of Observational Causal Inference (OCI) seeks to identify causal relationships from observational data when no experimental variation and randomization are present.

However, as two of the authors recently noted: “Despite its widespread use, a growing body of evidence indicates that OCI techniques often stray from correctly identifying true causal effects [in marketing analytics].[1] This is a critical issue because incorrect inferences can lead to misguided business decisions, resulting in financial losses, inefficient marketing strategies, or misaligned product development efforts.” One of the most common and longstanding OCI techniques in marketing measurement is media and marketing mix models (MMM).

In our recent note, we called on the business and marketing analytics community to embrace experimentation and to use experimental estimates to validate and calibrate OCI models. The community response was vivid, including a contextualizing piece on AdExchanger.

It should be pointed out that this is not a new observation. Many early papers in OCI advocated for experimental validation of modeling results. For example, Figure 1 shows the abstract from a paper by M. L. Vidale and H.B. Wolfe in 1957.

Figure 1. The abstract from "An Operations-Research Study of Sales Response to Advertising."
(Vidale and Wolfe)
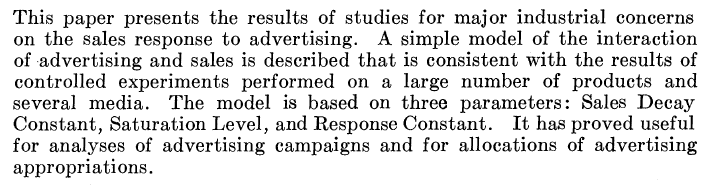
Figure 1. The abstract from “An Operations-Research Study of Sales
Response to Advertising.” (Vidale and Wolfe)

What is new is that, in the modern internet era, wide-scale experimentation is now both possible and widely accessible. It’s still not easy, but it is doable.

Types of Experiments in Marketing

In its broadest sense, marketing experimentation refers to any intentionally designed intervention that can help marketers measure the effects of their actions. This includes deliberate variations in spend, share, allocation, or other strategic and tactical decisions made for the purpose of measurement.

For instance, a marketer might introduce intentional variation in daily or weekly spending for a specific channel to estimate its impact on outcomes. By analyzing how performance changes with these fluctuations, marketers can better isolate and quantify the channel’s true effect.

In more extreme cases, experimentation might involve “going dark”—completely halting marketing activity in a specific channel or geographic location. By observing the performance drop (or lack thereof) when marketing is paused, marketers can try to measure the incremental impact of that channel. While this approach can yield insights, it comes with risks (such as confounding variable bias), particularly in high-stakes environments where even short-term losses are undesirable. And it clearly is not an RCT where we know that effect estimates will be unbiased on average.

Tests with Treatment and Control Groups

Narrowing the focus, experimentation can be defined as specifically designed tests that involve treatment and control groups to estimate effects. Under this definition, experimentation encompasses a wide spectrum of tests, ranging from basic ad platform tools to more rigorous methodologies.

Many advertising platforms, like Google and Facebook/Meta, provide split (or A/B) testing tools. These often self-serve tools enable marketers to compare various tactics or creative assets without the need for control groups, using only exposed, non-overlapping audiences.  Split testing tools divide the audience into two or more groups, each receiving a different version of the ad. Marketers might also run simultaneous campaigns with varying parameters to observe performance differences.

While these tools can be useful for directional insights, split tests are typically used to optimize specific campaign elements because they fall short of delivering incremental measurements.

The Gold Standard: Randomized Control Trials (RCTs)

Randomized Control Trials (RCTs) are often called the gold standard of effectiveness research. In an RCT, ad exposure is fully randomized across users, with some users serving as a control group who do not see the ad or campaign being measured. This level of rigor ensures that the treatment effect (the ad’s impact) can be isolated and measured without bias on average.

RCTs are widely recognized as the most reliable method for causal inference. However, RCTs are often challenging to execute. Many marketers lack the ability to control ad exposure at the user level, particularly when working across multiple platforms or channels. Privacy regulations and restrictions on user-level data access have further complicated the implementation of RCTs in recent years.

Most ad platforms offer RCTs but sometimes these are not usable without dedicated support personnel (and they often require more effort to implement successfully).

A Practical Middle Ground: Cluster-Level Randomized Experiments

When user-level randomization is not feasible, cluster-level randomization and experiments can offer a practical alternative. In cluster-level randomization, the assignment of experimental ads is managed at broader levels, like geographic regions, rather than at the level of the individual user. With geo experiments, the most common type of cluster experiments, ad exposure is varied at a geographic level – such as ZIP codes, designated market areas (DMAs), or cities – rather than at the level of individual consumers. Some regions serve as test groups, receiving the ad campaign, while others act as controls.

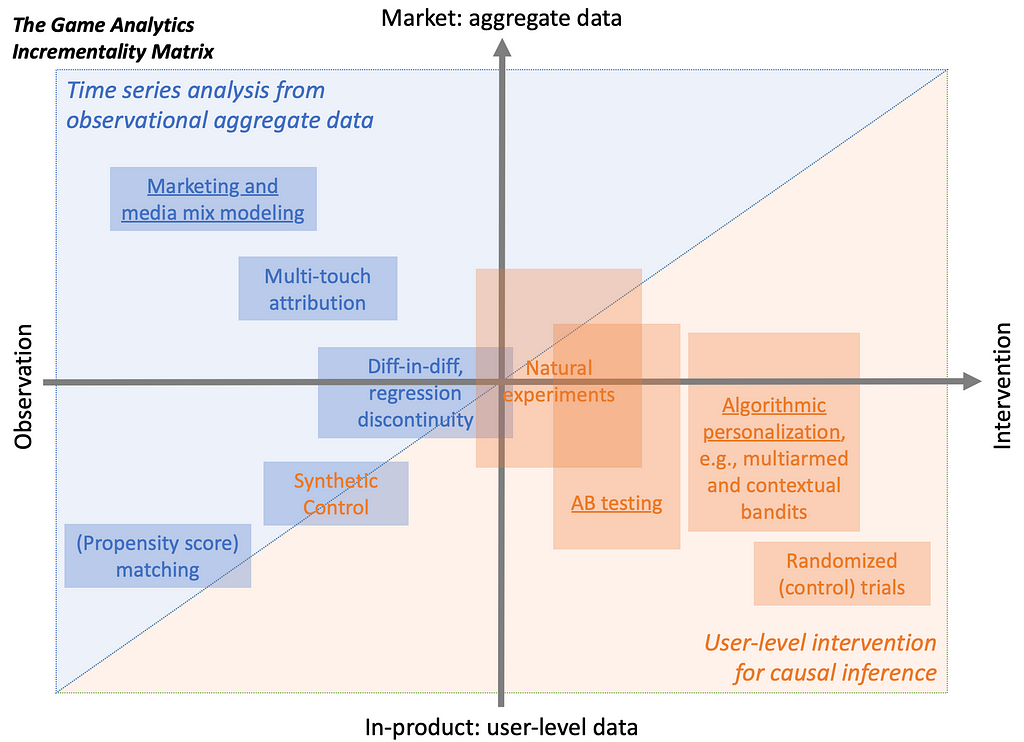
Geo experiments allow marketers to measure the incremental impact of campaigns while avoiding some of the complexities of user-level RCTs. They are particularly valuable when privacy or technological restrictions limit access to granular user data or when there might be spillover effects (a spillover effect is an unintended impact of a marketing intervention or campaign on individuals, groups, or regions that were not directly targeted by the campaign. This can occur when the influence of an advertisement, message, or promotion “spills over” to adjacent groups or regions, leading to indirect exposure and potential behavior changes outside the intended treatment group). Figure 2 below provides an overview of the different types of experiments available to marketers in different situations (source: Figure 1 in this article):

Figure 2. Taken from "It’s time to close the experimentation gap in advertising:
Confronting myths surrounding ad testing."
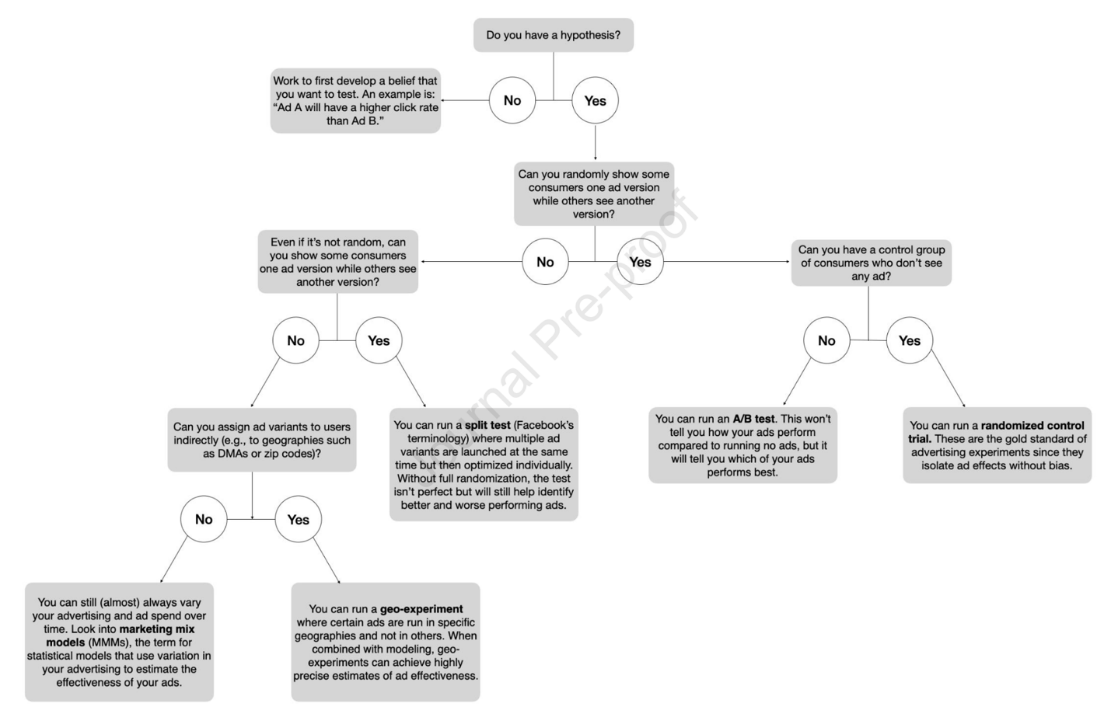
Figure 2. Taken from “It’s time to close the experimentation gap in advertising:
Confronting myths surrounding ad testing.”

There is also another reason that clustered experimentation is sometimes desirable. Choosing a small sub-population, or experimenting within a restricted demographic or geography is often a way to mitigate perceived risk. If key stakeholders are uncomfortable experimenting on the entire population, or worried about the potential impact of spillover effects, isolating to a small sub-population can be a good compromise.

However, clustered experiments are not without challenges. They require careful planning, significant resources, and rigorous execution to ensure clean results. Marketers must account for regional differences, external factors, and spillover effects (where the impact of a campaign in one region influences neighboring regions). It can also be challenging to hold out large cities with attractive contiguous market areas from campaigns, making it challenging to create balanced test and control market groups.

Successful Experimentation Requires a Commitment Across the Organization

Organizational success with experimentation requires more than just tools and processes. Most of the time, it requires a cultural shift and support. Executives must encourage teams to test hypotheses, embrace failure as a learning opportunity, and prioritize data-driven decision-making. Executive buy-in is critical to ensure experimentation becomes a core part of your marketing strategy. Here are a set of essential steps that can help you succeed:

Staff and Endorse Marketing Analytics Appropriately

The foundation of a successful experimentation program lies in having the right people and organizational support. This starts with hiring a dedicated data scientist or analytics team with expertise in marketing measurement and experimental design and analysis. These experts will be responsible for designing, running, and analyzing experiments and ensuring that insights are actionable.

Equally important is securing executive endorsement. A dotted reporting line to a C-level executive can signal the strategic importance of marketing analytics and experimentation. This endorsement helps prioritize the initiative across the organization and ensures that resources are allocated effectively.

Foster a Culture of Experimentation

For experimentation to thrive, firms must embed it into their organizational culture. This means fostering curiosity, encouraging data-driven decision-making, and rewarding teams for testing assumptions – even when experiments don’t yield the desired outcomes.

Leadership plays a critical role in shaping this culture. By promoting the value of experimentation and celebrating learnings from both successes and failures, executives can inspire teams to embrace testing as a core part of their workflow.

Depending on the setup of your wider analytics organization and if there is a central experimentation team and platform, it can be wise to formally link the marketing analytics group up with the platform team. Research suggests that organizations with mostly decentralized decisions but a single authority that sets consistent implementation thresholds achieve more robust returns to experimentation. Experiment-based innovation and learning further thrive on cross-pollination, which the central team can facilitate.

One of the most challenging obstacles within an organization is overcoming the silos that exist between various departments, such as analytics, planning, strategy, marketing, finance, and leadership. These silos can hinder communication, collaboration, or the flow of information, ultimately impacting the organization’s ability to make data-informed decisions and execute effective strategies.

Commit to a Learning Agenda and Hold the Marketing Analytics Team Accountable

Bridging these departmental gaps requires a concerted effort to foster a culture of collaboration and open communication. One powerful approach to breaking down barriers is committing to a learning agenda that encourages cross-departmental engagement with shared objectives. By aligning all teams around common goals and promoting continuous learning, commitment to a joint learning agenda can be the single most important step in transforming organizational dynamics.

Ask the marketing analytics team to set clear objectives and a roadmap for experimentation. Every experiment should begin with a specific, measurable goal. The team needs to be able to answer questions like: What do we want to learn? What are the hypotheses we are testing? How will the results influence our decisions? How will we use the results in the wider measurement framework, e.g., to validate and calibrate OCI models? Clear objectives ensure that experiments are focused and actionable. They also help prioritize testing efforts, directing resources toward questions with the highest potential impact.

Create Feedback Loops

The true value of experimentation lies in its ability to inform decision-making. Firms need to establish feedback loops where insights from experiments inform future campaigns, strategies, and even the design of new experiments. Regularly reviewing and acting on experimental results, possibly following a fixed-timed process, ensures that insights drive tangible business outcomes. This iterative approach fosters continuous improvement and adaptation to changing market dynamics.

Tactics that Lead to Successful Experimentation

To integrate experimentation into marketing measurement effectively, marketing analytics teams must establish a clear framework that balances rigor and practicality. Here’s how marketers can get started:

Align Hypotheses, Objectives, and Governance

Commit to a learning agenda as a practical first step that fosters cross-departmental collaboration and aligns all relevant teams around shared objectives, helping to overcome organizational or communicational silos.

Start with Broad Interventions


If your team is new to experimentation, begin with simpler interventions, such as introducing controlled variations in spending or campaign parameters. For example, randomly adjusting daily spending across campaigns can help identify baseline performance trends and directional insights.

Leverage Platform Tools and External Know-How


Modern marketing platforms like Google Ads and Meta Ads Manager include built-in experimentation tools. These platforms allow firms to test different variables – such as targeting criteria or bidding strategies – directly within their campaigns. Use these tools as a stepping stone. While these tests may not meet the highest standards of rigor, they can provide valuable learnings when executed thoughtfully. Ensure you understand the limitations of these tools, particularly around randomization and confounding.

Similarly, if you are primarily active on one or a couple of ad platforms, the provided attribution tools can provide reasonably reliable estimates of your advertising effectiveness. Build on these insights directly to validate and calibrate OCI models if you have those.

Firms can also turn to specialized vendors like Optimizely, Eppo, Adobe Target, or Game Data Pros for more complex needs. These vendors provide advanced capabilities for designing and analyzing experiments and building related software tools. Investing in these tools can streamline the experimentation process and make it easier to scale testing efforts.

Incorporate Cluster-Level Experiments


Whenever feasible, prioritize RCTs. Collaborate with platforms, publishers, or third-party measurement providers to implement RCTs that deliver unbiased causal estimates. RCTs may not always be practical, but they should remain the gold standard you aspire to. One particular caveat is to make sure there is enough statistical power: insufficient budget or duration can undermine the reliability of the experiment and results. To address this, ensure an adequate budget, duration, and holdout is applied based on power calculations.

As your experimentation capabilities mature, explore geo and other cluster-level randomized experiments to measure the incremental impact of campaigns. Partner with data scientists or measurement specialists to effectively design and execute these tests. Geo experiments can bridge the gap between observational measurement and user-level RCTs.

Set up OCI model(s)

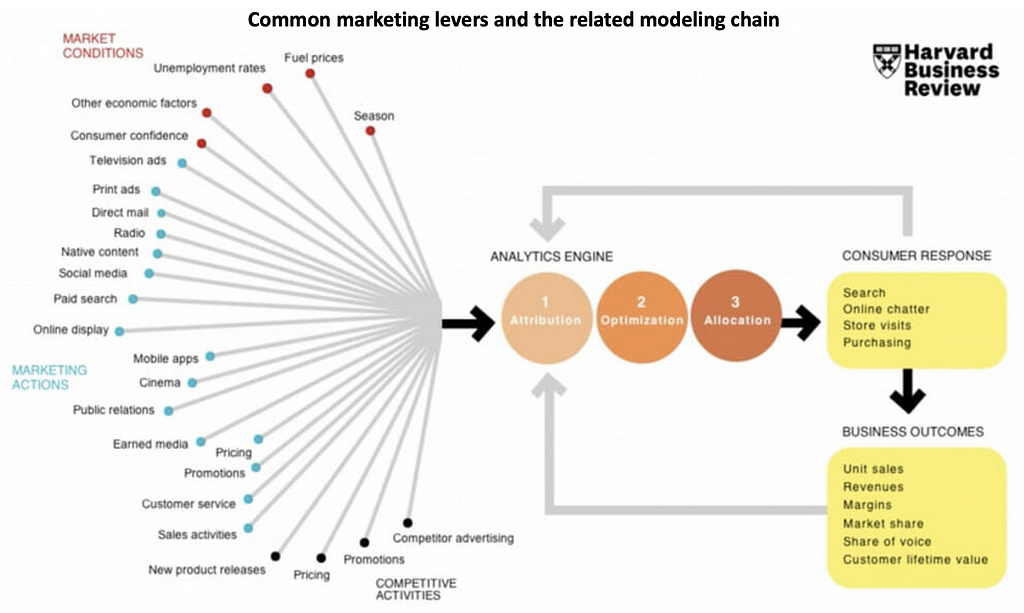
Once your marketing efforts involve more than two channels and you’re looking to scale up, it is time to build a comprehensive measurement framework that captures the full scope of these marketing activities. This involves cataloging marketing activities, i.e., listing all current and upcoming campaigns, channels, and tactics, along with their associated costs and KPIs. The figure in this article may be helpful for this exercise. Then set up a holistic measurement model, e.g., a media or marketing mix model, that includes all these activities plus control variables, trends, and adstock. This article provides an introduction to how you can do this using an open-source package.

A holistic model serves as the baseline for measuring the incremental impact of experiments and provides a framework for interpreting results in the context of broader marketing dynamics. Figure 3, taken from a presentation by Meta, visualizes how different OCI approaches can come together with experimentation.

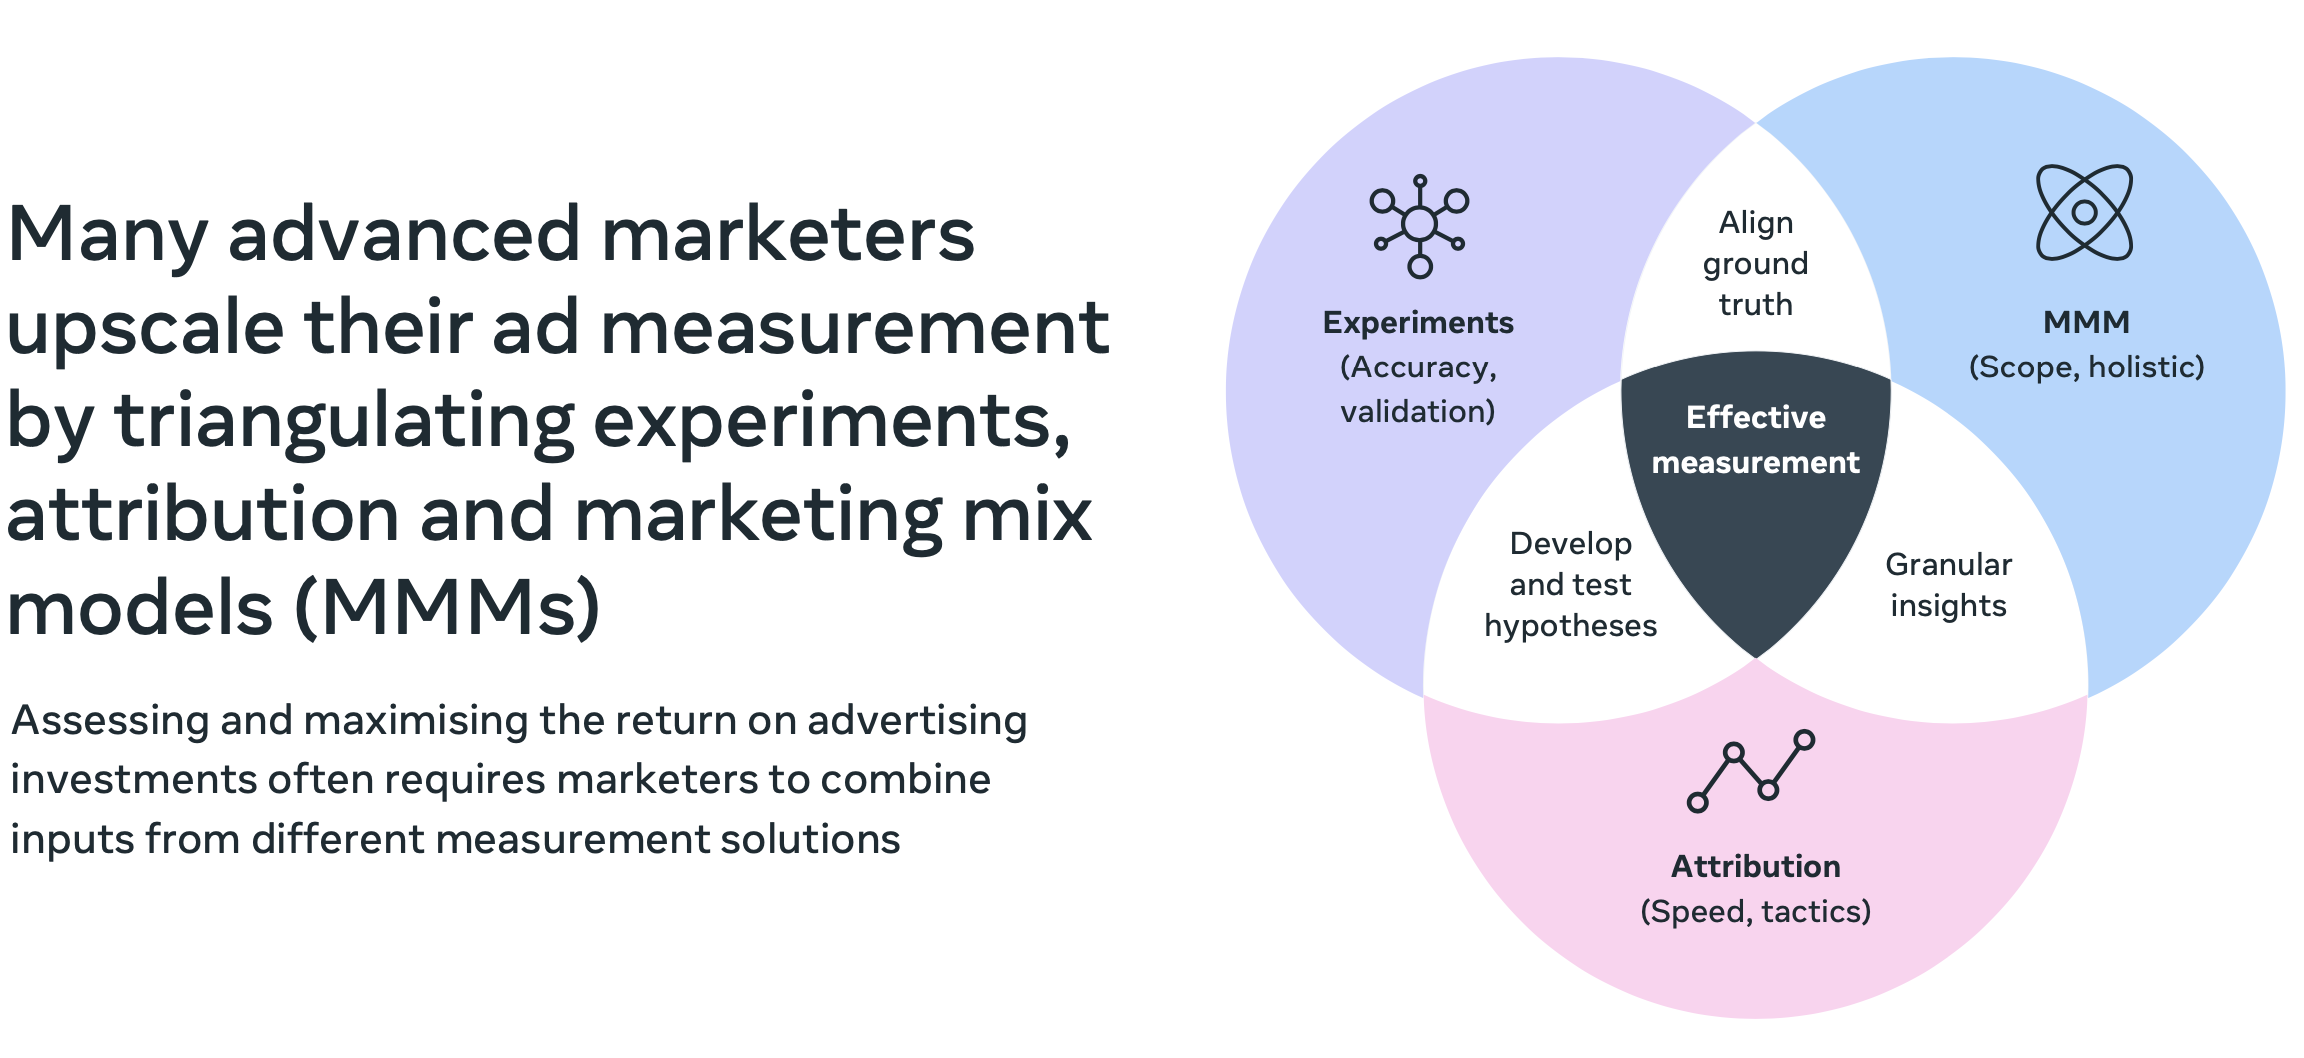
Figure 3. Taken from a Presentation by Meta.

Validate OCI Model(S)

Take the outputs from split tests, trusted attribution models, geo experiments, and RCTs to validate and calibrate your observational measurement models. To start, you can compare experimental and observational model results to ensure that they are “similar.” Similar can mean that both approaches pick the same winning ad variant/strategy or directionally agree. If the results are inconsistent, update the observational model to achieve similarity.

A somewhat more advanced approach uses experiment results to choose between OCI models. The marketing analytics team can build an ensemble of different models and then pick the one that agrees most closely with the ad experiment results for the KPI of interest, e.g., cost per incremental conversion or sales.

Calibrate OCI Model(s)

The most advanced and quantitative approach incorporates experiment results into the OCI model directly. Getting this right requires a robust understanding of statistical modeling. In a Bayesian modeling framework, the experimental results can enter your model as a prior. In a Frequentist model, they can serve to define a permissible range on the coefficient estimates: Say your experiment shows a 150% return-on-ad-spend with a 120% lower and 180% upper confidence bound; you can constrain your model’s estimate for that channel to that range.

Under a machine learning approach, you can use multi-objective optimization. Meta’s Robyn package does this: You can set it to not only optimize for statistical fit to observational data but also for minimal deviation from experimental results. This article provides a detailed walk-through of this relatively novel idea.

Identify Channels that Have Too Little Data for OCI Models to Work

OCI Models, like all machine learning models, require data for creation and calibration. For example, an advertising channel must have a volume of historical data above a minimal threshold and variations in spend and exposure in order to be meaningfully incorporated into an MMM model.  

If an MMM model has an advertising channel with too little data, several strategies can help address the issue. For example, incorporating prior knowledge through Bayesian methods can help stabilize estimates when data is sparse. Grouping similar channels with shared characteristics also allows performance to be estimated collectively, assuming similar behavior. In either case, experiments can quickly generate additional data to validate assumptions.

Integrating Experiments Pays Off

In conclusion, integrating experimentation into marketing measurement is essential for improving the accuracy and reliability of advertising effectiveness insights. While observational methods like MMM and OCI models provide valuable insights, they can suffer from biases without experimental validation. Controlled experiments can help calibrate and enhance these models by offering unbiased causal estimates.

However, success with experimentation requires work and planning. It requires an organizational commitment to data-driven decision-making, cross-departmental collaboration, and continuous learning. By aligning hypotheses, leveraging platform tools, fostering a culture of testing, and iteratively improving OCI models with experimental data, organizations can optimize resource allocation, better measure performance, and seize new growth opportunities across channels. Ultimately, experimentation transforms marketing from intuition-based strategies to a rigorously tested framework that drives both short-term results and long-term growth.

The effort is worth it though. Evidence is mounting that OCI can often stray far from the estimates of RCTs and  that firms that embrace experimentation as an analytics strategy do better. It’s not either OCI or ad experiments. It’s OCI and ad experiments.

We hope our article will help you get started.


[1] For the case of advertising, e.g., see Blake, Nosko & Tadelis (2015), Gordon et al. (2019), or Gordon, Moakler & Zettelmayer (2022); for the case of pricing, Bray, Sanders & Stamatopoulos (2024).

Community Perspectives on Our Article About Observational Causal Inference

A few weeks ago, GDP’s Bill Grosso and Julian Runge wrote an article about the potential pitfalls of observational causal inference modeling—Combating Misinformation in Business Analytics: Experiment, Calibrate, Validate—with a particular focus on Media Mix Modeling. The article originally appeared as a guest post on Eric Seufert’s Mobile Dev Memo and has also been reposted on the GDP blog. It sparked a wide variety of comments on LinkedIn (and an article on Ad Exchanger), and we decided to collect the community response.

But before we get to the responses, let’s quickly summarize the background for writing the article in the first place.

Evidence increasingly reveals that observational causal inference (OCI)—methods that infer cause-and-effect relationships from existing data—often leads to misjudgments about the impact of business strategies. Unlike randomized controlled trials (RCTs), OCI relies on naturally occurring data patterns, which are susceptible to biases and unobserved variables. These inaccuracies can result in flawed conclusions about business effectiveness, risking wasted resources and harm to market position. Accurate insights are vital for guiding investments, pricing, and marketing strategies, making rigorous experimental validation essential in contexts where causality drives financial and strategic outcomes.

Bill and Julian discuss the limitations of OCI in business analytics, citing methods like Media and Marketing Mix Modeling (m/MMM), which often misattribute causality due to issues like endogeneity and omitted variable bias. They advocate for prioritizing experimental approaches, such as A/B tests and RCTs, to establish causal clarity. Additionally, they recommend using experimental results to calibrate observational models, correcting biases and improving accuracy. By integrating experimentation with model calibration, businesses can enhance analytics reliability and make better-informed decisions.

Photo by John Schnobrich on Unsplash

Two Significant Recent Papers that Prompted the Original Article

The pace of academic articles about possible issues with observational causal inference has increased in recent years. In particular, Julian and Bill cited two recent papers. The first paper was Observational Price Variation in Scanner Data Cannot Reproduce Experimental Price Elasticities, by Robert Bray, Robert Evan Sanders, and Ioannis Stamatopoulos. 

The authors analyzed 389,890 randomized in-store supermarket prices across 409 products in 82 test stores and found that experimental price elasticity averaged -0.34, while observational data from 34 control stores suggested an elasticity of about -2.0. This highlights a significant mismatch between observational and experimental estimates of demand elasticity. Observational data suggest that retailer prices are in the elastic range, whereas experimental results indicate pricing in the inelastic range. This discrepancy cannot be attributed to typical factors like estimator properties, price variation processes, or elasticity timeframes. The findings challenge the reliability of observational demand elasticity estimates and raise questions about standard economic models’ applicability to retail pricing. 

Julian and Bill also cited Close Enough? A Large-Scale Exploration of Non-Experimental Approaches to Advertising Measurement, by Brett R. Gordon, Robert Moakler, and Florian Zettelmeyer, in which the authors evaluate the accuracy of non-experimental methods in estimating the causal effects of digital advertising. Utilizing data from 15 Facebook advertising experiments across 11 brands, the researchers compare experimental results with those derived from observational models, including matching, inverse probability weighting, and regression. The findings reveal that these non-experimental approaches often produce biased estimates, with the direction and magnitude of bias varying across brands and methods. This variability underscores the challenges of relying on observational data for advertising measurement. 

Concurring Commentary from AdExchanger

James Hercher, in his article Learning To Love And Let Go Of Attribution Models on AdExchanger, makes a strong case for our article, saying that while mix models and other attribution approaches have been essential tools for understanding marketing impact, they often fall short in today’s complex media landscape.  

Hercher highlights the limitations of models like media mix modeling (MMM) and multi-touch attribution (MTA), which can misattribute causality due to factors such as endogeneity and unseen variables behind emerging MMM tooling, echoing the concerns we raise in our article.

There are other reasons not to trust the MMM trend as a ‘truthier’ attribution fallback, now that multitouch attribution and user-lever tracking is infeasible.

And that’s because MMM might just become another walled garden platform plaything.

Earlier this year, Google open-sourced its own MMM product, which it calls Meridian. Meta has an open-source MMM solution it calls Robyn, while Amazon’s is still a proprietary product, not open-source.

But platform MMM is the same as platform anything. It’s there to prove the platform succeeded, as much as that your marketing worked. Google’s Meridian, for example, is really good at tying together search, YouTube, TV and Google Ads campaigns.

Hercher argues that these traditional models, while helpful in a simpler media environment, are now less effective at navigating the fragmented, multichannel advertising landscape. Instead, he supports our emphasis on integrating experimentation and validation, underscoring that models should not be relied upon as standalone truths. He agrees that mixing empirical experimentation, such as A/B tests, with calibration of observational data allows marketers to correct for biases and improve attribution accuracy.  

Hercher’s view aligns with our stance that business analytics must move beyond traditional attribution models and embrace an iterative, hybrid approach to better capture the causal effects of marketing strategies and guide informed decision-making. 

Discussion in the Community 

The article also resonated with many of our peers in the community, generating a variety of thoughtful comments and discussions after Bill and Julian posted their article on LinkedIn. 

The team at Haus, a startup marketing science platform that helps companies measure the incremental ROI of online and offline ad spend, had a lot to say about our take on MMM and causal analysis. 

Zach Epstein, Founder and CEO at Haus, agrees in principle and notes that experiments are hard: 

This is a great article that covers a lot of the issues we see day in and day out. What I think is less appreciated, especially in the world of advertising, is how difficult it is to run great experiments. The concept of running experiments alone won’t solve this problem – there’s a tremendous need for increasing access to world class methods and infrastructure.  

Running an experiment is easy. Running an experiment that you’d bet your own money on is extremely difficult. 

Chandler Dutton, who works on Customer Success at Haus, also agrees in principle and points out that, in practice, results do not match models

This piece thoughtfully explains not just why I’ve been insistent on every brand I know needing to work with a partner like Haus, but why I joined the team. 

Too often, marketing teams are chasing outputs from observational modeling only and trying to use those to inform multi-million dollar decisions without those models being able to prove causality. Whether for its own sake or for the purpose of calibrating such observational models, experimentation is critical and the only path towards getting really actionable data.  

I’ve seen teams chase their modeled attribution results and not have their resulting investments drive the results the model pointed towards. I’ve also seen teams drive incredible success without really knowing why and what to do next to pour gasoline on the fire. The missing piece is experimentation. I’d recommend all of the growth marketers in my network read this one. 

Olivia Kory, who works on Incrementality Testing at Haus, also agrees we need experiments

Dr. Julian Runge and William Grosso just released a very important guest essay in Eric Seufert’s Mobile Dev Memo about the shortcomings of observational causal inference modeling, specifically MMM. In their words: 

Evidence is mounting that observational causal inference (aka MMM) often misinforms about the actual impact of business strategies and actions, and this means we need more experimentation — for baseline evaluation of policies, for validation of observational insights, and for calibration of observational models. 

“When a new drug is tested, RCTs are the gold standard because they eliminate bias and confounding, ensuring that any observed effect is truly caused by the treatment. No one would trust observational data alone to conclude that a new medication is safe and effective. So why should businesses trust OCI techniques when millions of dollars are at stake in digital marketing or product design?” 

Photo by charlesdeluvio on Unsplash

Others in the community also reacted strongly to the article. 

Tony Williams, an Economist and Director of Data Science at FlowPlay, agrees and wonders if a greater focus on advanced data science techniques (matching methods, et al) might help: 

Definitely excited to read this since I’ve spent the last few days looking at valid matching methods for multiple variants and have been surprised that the academic literature hasn’t covered this more. I know you’re looking at something different (MMM), but as someone who loves experimentation, there are also times we need other methods.  

Very cool to see this discussion getting brought up! 

Jim Kingsbury, an E-Commerce Marketing Advisor who has worked with Zappos, Allbirds, KiwiCo, and Amazon, agrees and lists vendors who routinely do AB tests to verify models:

Running geo-lift tests to validate – or, if needed, calibrate – the output of an MMM is becoming table stakes. 

This essay is a great reminder of how important this is. 

To marketing leaders out there who are using or evaluating MMM solutions, I recommend asking the vendor about their process to validate what their model claims.  

If the vendor hems & haws in response to this question, I’d recommend finding other vendors who enthusiastically embrace this critical step. 

A few vendors I know who always do this include: 

  • SegmentStream 
  • WorkMagic 
  • LiftLab 

I’m sure there are others who do this and I’m excited for anyone reading this post to share who they are. 

A longer back-and-forth discussing the comparison of MMM to drug trials occurred between Jimmy Marsanico, VP of Product at Prescient AI, and Toma Gulea, Lead Data Scientist at Polar Analytics, debating whether comparing marketing to other verticals makes sense: 

I appreciate the focus on measurement rigor, but the paper’s comparison of marketing measurement to drug trials misses some crucial real-world complexity. In clinical trials, control groups get placebos in isolation. But in digital advertising, ‘control’ users are actively shown alternative ads competing for the same share of wallet. When a control user purchases a competitor’s product after seeing their ad instead of yours, they’re naturally less likely to buy your product – not because your ad wouldn’t have worked, but because they already spent their budget elsewhere. This makes the ‘untreated’ state anything but neutral, potentially leading experiments to undercount true advertising impact. 

While empirical tools like incrementality tests provide valuable data, treating any single approach as ‘table stakes’ oversimplifies the challenge. The most successful brands recognize that marketing measurement is more art than perfect science – they triangulate insights from multiple sources (sometimes by leveraging dynamic and regularly updated MMMs, like that of Prescient AI ) and combine them with strategic thinking and domain expertise. 

After all, isn’t the goal to make better decisions, not just chase methodological purity? 

Toma replied: 

Jimmy M. But that’s actually what you want to test. For example if you were to cut your spending overall on a channel, what you describe would happen (consumers shifting to competitors) and that’s exactly these external factors you want to account for when evaluating the true impact of your ads. Am I wrong? 

Jimmy clarified his take on the differences between marketing and drug trials. 

Toma Gulea 🤔 I’m not quite sure we’re saying different things here. The comparison and example of pharmaceuticals is just inherently different in the approach of test/control groups because during a hold out test, your competitors aren’t holding out (but during a pharmaceutical test you’re not taking a competitor’s drug to treat your symptoms). 

Alluding to your other comment below, you’re right — if you’re going to cut spend on a channel (or double it perhaps), if you’ve only spent the same amount daily on that channel, or campaign, there’s less data (or confidence) in the relationship of spend to revenue at any other spend value — making it a model to help make decisions, not a perfect crystal ball to predict impact of ALL future changes. Thus, my argument against “table stakes” — there is value… but only when used appropriately — that applies to any measurement tool. 

And Toma concluded that there are more parallels than differences: 

The principle is the same: isolating the effect of a treatment (or ad exposure) to estimate causal impact. Your competitor’s ad becoming more effective as a result of a change in ad exposure is absolutely part of the causal impact you want to test. The only difference with Pharma is the elimination of the “Placebo effect”.  

Even in pharma, participants in control groups don’t exist in a vacuum—Consider a holdout test for a new pain medication. Some participants in the control group might be taking over-the-counter pain relievers during the trial, while the treatment participants are not. The intervention still caused participants to stop the alternative medication, leading to a better or worse outcome. 

The only thing an RCT can give you is the impact of the intervention on the outcome in the real world, not the mechanism. 

Your change in ad spend causes a drop in revenue because of competition, then so be it—that’s the real-world outcome you’ll get, just like an outcome for a medication is influenced by the use of an alternative medicine. 

Randomized control trials are often impractical, unfeasible, or too costly, and other methods should be employed. But an RCT is an RCT, and the comparison with pharma is absolutely correct.  

Separately, Toma Gulea made an interesting general observation about the differences between claims and the actual value of using MMMs. 

A typical claim from MMM vendors: “testing the model’s accuracy on a separate holdout period ensures its trustworthiness”.  

This misses the core purpose of an MMM. The real goal isn’t simply to predict revenue based on past marketing spend, but to uncover the causal relationship between channel spending and revenue outcomes. The key question is: ‘What would happen if I spent X?’ In situations where the marketing spend has been stable over time, evaluating accuracy on historical data is meaningless because it doesn’t assess how the model will perform when actual changes occur. When it does, your MMM will break and you will realize it’s useless. 

The right approach requires a causal lens: 

  • Start by understanding the business and marketing strategy to identify confounders and latent variables. 
  • Then, apply causal methods and gather control and instrumental variables. 
  • Avoid the lure of “predictive accuracy”: you can’t observe the true relationship you are trying to model. The goal is to have a useful model! 

Kenneth Wilbur, Professor of Marketing and Analytics at the University of California, San Diego – Rady School of Management, made the interesting point that experimentation was viewed as important in the early papers but somehow dropped out of daily practice:

Some of the original MMM literature in the 1950s pointed out that MMMs obviously needed to be calibrated with experimental variation in spending. 

An Operations-Research Study of Sales Response to Advertising, by M. L. Vidale and H. B. Wolfe (1957), demonstrates the necessity of precise, reproducible data to evaluate advertising effectiveness. Through controlled experiments, the authors identified key parameters—Sales Decay Constant, Saturation Level, and Response Constant—that define sales responses to advertising campaigns. These parameters enable the development of predictive mathematical models to optimize advertising efforts and budget allocations. The study emphasizes that well-designed experiments provide actionable insights for tailoring strategies to maximize return on investment, underlining the critical role of empirical data in refining marketing decisions.

A Media Planning Calculus, by John D. C. Little of MIT and Leonard M. Lodish of the University of Pennsylvania (1969), emphasizes the importance of experimentation in developing an effective marketing or MMM strategy by introducing a structured approach to media planning, known as the Media Planning Calculus, and recommending experimental calibration wherever feasible. The authors advocate for controlled experiments and computational modeling to measure and predict market responses to advertising. By integrating concepts like exposure frequency, forgetting, audience segmentation, and diminishing returns, the study demonstrates how experimentation refines parameter estimations, such as exposure values and response functions. This empirical grounding allows for dynamic optimization of advertising schedules and budgets, significantly improving marketing efficiency.

It is awesome to be reminded of these papers that already called out the necessity for experimental calibration of OCI and m/MMM almost 60 years ago.

We are very excited by the positive reception of our analytics strategy opinion piece. GDP is committed to precise analytics and driving forward best practices in gaming and beyond. 

Combating Misinformation in Business Analytics: Experiment, Calibrate, Validate

This article originally appeared as a guest post on Eric Seufert’s Mobile Dev Memo, written by Dr. Julian Runge, an Assistant Professor of Marketing at Northwestern University, and William Grosso, the CEO of Game Data Pros.

Observational Causal Inference (OCI) seeks to identify causal relationships from observational data, when no experimental variation and randomization are present. OCI is used in digital product and marketing analytics to deduce the impact of different strategies on outcomes like sales, customer engagement, and product adoption. OCI commonly models the relationship between variables observed in real-world data.

In marketing, one of the most common applications of OCI is in Media and Marketing Mix Modeling (m/MMM). m/MMM leverages historical sales and marketing data to estimate the effect of various actions across the marketing mix, such as TV, digital ads, promotions, pricing, or product changes, on business outcomes. Hypothetically, m/MMM enables companies to allocate budgets, optimize campaigns, and predict future marketing and product performance. m/MMM typically uses regression-based models to estimate these impacts, assuming that other relevant factors are either controlled for or can be accounted for through statistical methods.

However, MMM and similar observational approaches often fall into the trap of correlating inputs and outputs without guaranteeing that the relationship is truly causal. For instance, if advertising spend spikes during a particular holiday season and sales also rise, an MMM might attribute this increase to advertising, even if it was primarily driven by seasonality or other external factors.

When a new drug is tested in a clinical trial, randomized control trials are the gold standard because they eliminate bias and confounding, ensuring that any observed effect is truly caused by the treatment. No one would trust observational data alone to conclude that a new medication is safe and effective. While not usually dealing in questions of life and death, the stakes in business analytics can also be very high. Solely relying on observational causal inference is a risk that needs to be taken in full awareness of the limitations of the approach. (Photo by Michał Parzuchowski on Unsplash) 

Observational Causal Inference Regularly Fails to Identify True Effects

Despite its widespread use, a growing body of evidence indicates that OCI techniques often stray from correctly identifying true causal effects. This is a critical issue because incorrect inferences can lead to misguided business decisions, resulting in financial losses, inefficient marketing strategies, or misaligned product development efforts.

Gordon et al. (2019) provide a comprehensive critique of marketing measurement models in digital advertising. They highlight that most OCI models are vulnerable to endogeneity (where causality flows in both directions between variables) and omitted variable bias (where missing variables distort the estimated effect of a treatment). These issues are not just theoretical: the study finds that models frequently misattribute causality, leading to incorrect conclusions about the effectiveness of marketing interventions, highlighting a need to run experiments instead.

A more recent study by Gordon, Moakler, and Zettelmeyer (2023) goes a step further, demonstrating that even sophisticated causal inference methods often fail to replicate true treatment effects when compared to results from randomized controlled trials. Their findings call into question the validity of many commonly used business analytics techniques. These methods, despite their complexity, often yield biased estimates when the assumptions underpinning them (e.g., no unobserved confounders) are violated—a common occurrence in business settings.

Beyond the context of digital advertising, a recent working paper by Bray, Sanders and Stamatopoulos (2024) notes that “observational price variation […] cannot reproduce experimental price elasticities.” To contextualize the severity of this problem, consider the context of clinical trials in medicine.

When a new drug is tested, RCTs are the gold standard because they eliminate bias and confounding, ensuring that any observed effect is truly caused by the treatment. No one would trust observational data alone to conclude that a new medication is safe and effective. So why should businesses trust OCI techniques when millions of dollars are at stake in digital marketing or product design?

Indeed, OCI approaches in business often rely on assumptions that are easily violated. For instance, when modeling the effect of a price change on sales, an analyst must assume that no unobserved factors are influencing both the price and sales simultaneously. If a competitor launches a similar product during a promotion period, failing to account for this will likely lead to overestimating the promotion’s effectiveness. Such flawed insights can prompt marketers to double down on a strategy that’s ineffective or even detrimental in reality.

Prescriptive Recommendations from Observational Causal Inference May Be Misinformed

If OCI techniques fail to identify treatment effects correctly, the situation may be even worse when it comes to the policies these models inform and recommend. Business and marketing analytics are not just descriptive—they often are used prescriptively. Managers use them to decide how to allocate millions in ad spend, how to design and when to run promotions, or how to personalize product experiences for users. When these decisions are based on flawed causal inferences, the business consequences could be severe.

A prime example of this issue is in m/MMM, where marketing measurement not only estimates past performance but also directly informs a company’s actions for the next period. Suppose an m/MMM incorrectly estimates that increasing spend on display ads drives sales significantly. The firm may decide to shift more budget to display ads, potentially diverting funds from channels like search or TV, which may actually have a stronger (but underestimated) causal impact. Over time, such misguided actions can lead to suboptimal marketing performance, deteriorating return on investment, and distorted assessments of channel effectiveness. What’s more, as the models fail to accurately inform business strategy, executive confidence in m/MMM techniques can be significantly eroded.

Another context where flawed OCI insights can backfire is in personalized UX design for digital products like apps, games, and social media. Companies often use data-driven models to determine what type of content or features to present to users, aiming to maximize engagement, retention, or conversion. If these models incorrectly infer that a certain feature causes users to stay longer, the company might overinvest in enhancing that feature while neglecting others that have a true impact. Worse, they may even make changes that reduce user satisfaction and drive churn.

The Problem Is Serious – And Its Extent Currently Not Fully Appreciated

Nascent large-scale real-world evidence suggests that, even when OCI is implemented on vast, rich, and granular datasets, the core issue of incorrect estimates remains. Contrary to popular belief, having more data does not solve the fundamental issues of confounding and bias. Gordon et al. (2023) show that increasing the volume of data without experimental validation does not necessarily improve the accuracy of OCI techniques. It may even amplify biases, making analysts more confident in flawed results.

The key point to restate is this: Without experimental validation, OCI is at risk of being incorrect, either in magnitude or in sign. That is, the model may not just fail to measure the size of the effect correctly—it may even get the direction of the effect wrong. A company could end up cutting a channel that is actually highly profitable or investing heavily in a strategy that has a negative impact. Ultimately, this is the worst-case scenario for a company deeply embracing data-driven decision-making.

A/B tests, geo-based experiments, and incrementality tests can help establish causality with high confidence and calibrate and validate observational models. For a decision tree guiding your choice of method, e.g., consider Figure 1 here. In digital environments, the gold standard of conducting a randomized control trial is often feasible, for example, testing different versions of a web page or varying the targeting criteria for ads. (Photo by Jason Dent on Unsplash) 

Mitigation Strategies

Given the limitations and risks associated with OCI, what can companies do to ensure they make decisions informed by sound causal insights? There are several remedial strategies.

The most straightforward solution is to conduct experiments wherever possible. A/B tests, geo-based experiments, and incrementality tests can all help establish causality with high confidence. (For a decision tree guiding your choice of method, please see Figure 1 here.)

For digital products, RCTs are often feasible: for example, testing different versions of a web page or varying the targeting criteria for ads. Running experiments, even on a small scale, can provide ground truth for causal effects, which can then be used to validate or calibrate observational models.

Another approach is bandit algorithms that conduct randomized trials in conjunction with policy learning and execution. Their ability to learn policies “on the go” is the key advantage they bring. This however requires a lot of premeditation and careful planning to leverage them successfully. We want to mention them here, but advise to start with simpler approaches to get started with experimentation.

In reality, running experiments (or bandits) across all business areas is not always practical or possible. To help ensure that OCI models produce accurate estimates for these situations, you can calibrate observational models using experimental results. For example, if a firm has run an A/B test to measure the effect of a discount campaign, the results can be used to validate an m/MMM’s estimates of the same campaign. This process, known as calibrating observational models with experimental benchmarks, helps to adjust for biases in the observational estimates. This article in Harvard Business Review summarizes different ways how calibration can be implemented, emphasizing the need for continuous validation of observational models using RCTs. This iterative process ensures that the models remain grounded in accurate empirical evidence.

In certain instances, you may be highly confident that the assumptions for OCI to produce valid causal estimates are met. An example could be the results of a tried-and-tested attribution model. Calibration and validation of OCI models against such results can also be a sensible strategy.

Another related approach can be to develop a dedicated model that is trained on all available experimental results to provide causal assessments across other business analytics decisions and use cases. In a way, such a model can be framed as a “causal attribution model.”

In some situations, experiments and calibrations may not be feasible due to budget constraints, time limitations, or operational challenges. In such cases, we recommend using well-established business strategies to cross-check and validate policy recommendations derived from OCI. If the models’ inferences are not aligned with these strategies, double- and triple-check. Examples for such strategies are:

  • Pricing: Purchase history, geo-location, or value-based pricing models that have been extensively validated in the academic literature
  • Advertising Strategies: Focus on smart creative strategies that align with your brand values rather than blindly following model outputs
  • Product Development: Prioritize features and functionalities based on proven theories of consumer behavior rather than purely data-driven inferences

By leaning into time-tested strategies, businesses can minimize the risk of adopting flawed policies suggested by potentially biased models.

If in doubt, err on the side of caution and stick with a currently successful strategy rather than implementing ineffective or harmful changes. For recent computational advances in this regard, take a look at the m/MMM package Robyn. It provides the ability to formalize a preference for non-extreme results in addition to experiment calibration in a multi-objective optimization framework.

To see clearly and avoid costly mistakes, treat observational causal inference as a starting point, not the final word. Wherever possible, run experiments to validate your models and calibrate your estimates. If experimentation is not feasible, be critical of your models’ outputs and cross-check with established business strategies and internal expertise. Without such safeguards, your business strategy could be built on misinformation, leading to misguided decisions and wasted resources. (Photo by Nathan Dumlao on Unsplash)

A Call to Action: Experiment, Calibrate, Validate

In conclusion, while OCI techniques are valuable for exploratory analysis and generating hypotheses, current evidence suggests that relying on them without further validation is risky. In marketing and business analytics, where decisions directly impact revenue, brand equity, and customer experiences, businesses cannot afford to act on misleading insights.

“Combating Misinformation” may be a strong frame for our call to action. However, even misinformation on social media is sometimes shared without the originator knowing the information is false. Similarly, a data scientist who invested weeks of work into OCI-based modeling may deeply believe in the accuracy of their results. These results would however still misinform business decisions with potential to negatively impact share- and stakeholders.

To avoid costly mistakes, companies should treat OCI as a starting point, not the final word.

Wherever possible, run experiments to validate your models and calibrate your estimates. If experimentation is not feasible, be critical of your models’ outputs and always cross-check with established business strategies and internal expertise. Without such safeguards, your business strategy could be built on misinformation, leading to misguided decisions and wasted resources.

Dear Digital-First Advertisers, Are You Media or Marketing Mix Modeling?

As the adoption of MMM among digitally native businesses increases and matures, awareness of the differences between the two can open up new pathways for excellence in marketing analytics.

(Scroll to the end of the article for a TL;DR.)

MMM, commonly used to abbreviate marketing mix modeling, is experiencing a surge in interest among digital-first advertisers. App publishers, game companies, direct-to-consumer businesses, and others are all embracing a new measurement standard as private and regulatory privacy initiatives are rocking the data infrastructure of digital advertising. In lieu of deterministic attribution and measurement based on user-level data and identity graphs, advertisers are flocking to probabilistic measurement from coarser data and identity graphs such as at the campaign-, state-, DMA-, or country-level. Especially MMM, as the most comprehensive and holistic of probabilistic measurement methods, is finding adoption as marketers want to mitigate a risk of “flying blind” if user-level data access continues to deteriorate at the current pace.

Now, as everyone in digital advertising starts talking about MMM, there seems to be a conflation of the terms of marketing and media mix modeling. While the two are highly related and make of use of similar and in many ways identical methods, they are not the same. A recent report by the Marketing Science Institute nicely brings this point home by distinguishing MMM (marketing mix modeling) and mMM (media mix modeling). The key difference between the two is that MMM really is about supporting a firm’s decisions on the full marketing mix (see Figure 1), so product, price, promotion, and place/distribution, while mMM is about informing its decisions on the media mix, i.e., how it sets and allocates its media budget across media and advertising channels (see upper part of Figure 1).

This blog post aims to achieve three things:

(1) Revisit and summarize differences between MMM and mMM, mostly to help inform current industry conversations in digital advertising;

(2) Talk a little bit about why the concepts of MMM and mMM are often used synonymously and may have fused in digitally native business especially;

(3) Highlight that there may be valuable lessons to be gleaned for digital-first advertisers from the distinction of MMM and mMM.

Figure 1: This overview published by Harvard Business Review nicely summarizes the levers firms can work with to impact their marketing strategy and success. It also provides a succinct summary of the related analytics chain. The only lever I would add are a company’s own (new) product releases and launches. (Source: https://hbr.org/2013/03/advertising-analytics-20).

Differences between MMM and mMM

Both MMM and mMM are analytical approaches used by companies to understand the effectiveness of their marketing and advertising efforts. While they share similarities, they have distinct focuses and differences. MMM is a broader approach that analyzes the overall impact of various marketing elements on a company’s sales and other key performance indicators (KPIs). These marketing elements typically include a combination of the “Four Ps” of the marketing mix: Product, Price, Promotion, and Place (distribution). MMM aims to quantify the contributions of each of these elements, and their interactions, to overall sales.

As illustrated in Figure 2, media used for marketing is a subset of all modeling variables used in MMM. In this vein, mMM focuses on analyzing the effectiveness of different advertising media channels in driving sales and other KPIs and determining the optimal allocation of media budget across various channels to achieve the best return on marketing investment (ROMI). It thereby attributes sales or conversions to specific media channels, helping marketers understand which channels are driving the most value. In this way, mMM can sometimes offer insights at a more granular level, such as the impact of specific ad placements, time slots, or online platforms.

Due to their different scopes as shown in Figure 2, the two approaches require different historical data coverage. MMM requires data inputs addressing all the various marketing activities of interest, e.g., on all Four Ps (product, price, promotion, place), in addition to sales data, other relevant external factors (e.g., competitive and macroeconomic), and potentially media spend. While data on the Four P are often added to mMM as control variables, mMM does not require them per se and can work from media spend and sales data alone.

Figure 2: Media mix modeling (mMM) addresses a subset of the analytical scope of marketing mix modeling (MMM). The author believes that awareness of this difference in scope can hold valuable lessons for digital-first advertisers. (Image source: https://hbr.org/2013/03/advertising-analytics-20)

Similarities between MMM and mMM

In terms of model specification and the methodological approaches used for estimation of the models, MMM and mMM lean very similar and often use identical methods. An mMM can also be included in a company’s MMM, meaning a more comprehensive MMM covers media spend evaluation and optimization as a subset of its overall analytical scope. In both MMM and mMM, a simple starting point can be to estimate a parametric model of sales explained by investments in different actions on the Four Ps and in media. Usually, as mentioned above, such a model will also include variables addressing the competitive and macroeconomic landscape. From there, modeling for both MMM and mMM can become more sophisticated by modeling dynamic (e.g., ad stock) effects, interactions between different marketing levers, engineering specific features, using experiments to calibrate the model, and performing other tweaks. More advanced modelers also like to specify, possibly marketing action-specific, response curves that address diminishing returns to scale, e.g., due to saturation of an advertising medium.

While a simple use case of mMM and MMM can be to evaluate past marketing strategy, more advanced uses commonly include forecasting of future sales and optimization of future marketing strategy and actions. These more advanced use cases thereby require explicit assumptions and accommodations in the model. E.g., is the data generating process stationary? Did the competitive or macroeconomic landscape change? Are there new advertising media, product line extensions, or other changes that may require specific adjustments to allow the model to generalize from the past and present to the future? If we increase spending on this medium threefold, how quickly should we expect the returns to that investment to diminish? If we scale down advertising on TV, will sales in the next period be unaffected but may we see a major drop in future periods? If we run large-scale promotions in the next period, how will this in-/decrease and shift our sales between future periods? A model’s architecture will need to be finessed to be able to appropriately reflect these complexities. The larger the model’s scope (MMM > mMM) and the more advanced the use case (optimization > forecasting > evaluation), the more effortful and challenging this task, and the more insightful the resulting model, becomes.

In summary, MMM is a comprehensive analysis of various marketing elements, while mMM specifically focuses on assessing the impact of advertising across different media channels. Figure 2 succinctly captures this difference in analytical scope. Both approaches aim to provide data-driven insights to help companies make informed decisions about resource allocation and strategy in marketing.

Why are MMM and mMM often used synonymously, especially among digitally native advertisers?

By digitally native advertisers, I mean companies that were started and grew with the increased digitization of the production and delivery of consumer goods through the proliferation of the web, personal computers, social media, and then handheld devices. Examples are web-based and mobile gaming companies, direct-to-consumer businesses, app developers, digital (social) media platforms, or e-commerce operations. I believe there are a few factors that may have contributed to a conflation of MMM and mMM among these digital-first advertisers:

  • A distinction of mMM and MMM was simply not needed or relevant: Digitally native businesses primarily operate in the digital realm, relying heavily on online platforms, social media, and digital advertising for their marketing efforts. Since their marketing activities are predominantly digital, they often equate marketing with media, considering digital media as the core component of their overall marketing strategy.
  • Many digital media are priced “freemium:” Very much related to the previous point, digital consumer goods are predominantly offered under freemium pricing where initial product adoption and use are free. Price hence is much less of a relevant decision criterion for consumers, in turn affecting its importance in a firm’s marketing decision-making.
  • Digitization was accompanied by further significant shifts in the salience of the marketing mix’ Four Ps: As freemium pricing reduced the relevance of price in product adoption decisions, promotion is much less relevant as well. Plus, recent research suggests that the effects of price promotions may be very different for digital freemium consumer goods. Distribution collapsed to digital platforms and media or, in direct-to-consumer commerce, was replaced by target advertising and simply disappeared as an essential consideration.
  • On digital media, A/B tests and experiments can be conducted with ease: Publishers of digital goods did not need an MMM to inform their product, price, promotion, and place/distribution decisions. As illustrated in Figure 3, they had (and still have) access to granular, user-level data allowing them to run user-level A/B tests and other experiments to inform marketing and product initiatives. A/B tests and other experiments can be run at the user-level to get “gold standard” reads on price elasticity, inter-temporal substitution, and the effectiveness of promotions.
  • User-level data enable(d) granular analytics and decision support: Similarly, the available detailed first-party and often third-party data could fuel MTA (multi-touch attribution) models or elaborate product analytics efforts to evaluate and attribute merit to different product and marketing strategies and tactics. In digital advertising, this level of data access is currently under siege (so, for the third-party use cases in Figure 3), but it is likely to remain in place for the foreseeable future for first-party data. Thus, it can continue to support decision-making for product, price, and promotion on a firm’s proprietary digital offerings. When the only reasonable use case of an MMM is to support advertising decisions, it becomes an mMM (see Figure 2).I want to note that, while these factors might lead to the perception that MMM and mMM are the same, recognizing the distinction between assessments of the overall marketing strategy and of media channel allocation holds valuable lessons. A well-rounded approach considers all marketing elements, even in digitally native businesses, to enable a comprehensive and holistic understanding of the factors driving business growth. A more holistic and comprehensive model is also likely to provide more accurate estimates, e.g., of ROMI, for each individual marketing lever. Further, while user-level data and experimentation may still provide more accurate and reliable decision support in product, price, and promotion to digitally native businesses, setting up an MMM to complement, cross-check, and build on these other analytics tools is a worthwhile effort. It can bring “everything together” in one holistic model and provide valuable higher-level insights, e.g., on longer-term strategic and interaction effects that might otherwise go undetected.
Figure 3: Digitally native businesses have grown accustomed to using first-party experimentation and user-level analytics to support decisions in product, price, promotion, and third-party experimentation and user-level analytics in digital advertising. MMM-type modeling is hence mostly/only relevant to support media-related decisions. This may help explain why MMM and mMM seem to have collapsed to meaning the same for many digital-first advertisers. My inclusion of new product releases in the first-party experiment scope intends to refer to a company’s own product releases. (Image source: https://hbr.org/2013/03/advertising-analytics-20)

TL;DR / Take-Aways

Using the terms marketing mix modeling (MMM) and media mix modeling (mMM) synonymously really is no mistake if you’re running a fully digitally-centric business. Doing so however may lead to confusion (1) when you operate both on- and offline product and distribution, and (2) if you interface with traditional brand advertisers. So, keep the differences between traditional mMM and MMM in mind and see if you can learn anything for your digital-first MMM from “old school” brick-and-mortar marketing mix modeling:

  • Could you include data on price and promotion and inform your pricing and promotional strategies from your MMM? Could resulting estimates substitute and complement your existing price and promotion analytics, e.g., by reducing the need to run experiments?
  • Are there distribution and advertising channels that you have not considered so far and that could meaningfully increase demand for your product(s)?
  • Can a model that more comprehensively addresses your actions on the marketing mix surface insights on synergistic effects that you so far were unaware of? E.g., do promotional efforts increase the effectiveness of your advertising? Is there evidence that lowered prices in certain territories may increase product usage and in turn word-of-mouth in these regions?

In this way, as MMM adoption among digital-first advertisers matures, awareness of the differences between MMM and mMM can open up new pathways for excellence in marketing analytics. Once your mMM is in (a good) place, strive to complement it with an MMM as the next frontier of digital marketing analytics. MMM and mMM can work nicely together: E.g., you can use a more comprehensive MMM to assess your overall marketing strategy and set a media budget that you then allocate based on your mMM. Your media tactics can additionally be informed by further lower-level analytics such as an MTA model or campaign optimization tools. You can also use outputs from granular product analytics and experiments across product, price, promotion, and advertising to calibrate and fine-tune your marketing and media mix model. And you may be able to inform the design of treatments and strategies that you test experimentally using the insights provided by your MMM.

Incrementality in Game Analytics: Beyond AB Tests, on to Bandits and Marketing Mix Models

(For a TL;DR scroll to the end of the article)

Incrementality is a hot topic in marketing analytics, referring to “the measurement and analysis of the incremental impact of a marketing campaign or initiative. It aims to determine whether the marketing efforts are actually driving additional value or revenue beyond what would have occurred naturally without the campaign.” That’s the first paragraph of ChatGPT’s answer when prompted “What is incrementality in marketing analytics?”

When asked the same thing, Google delivers a similar answer drawing on the website Marketing Evolution: “Incrementality refers to growth that can be directly attributed to specific marketing efforts above and beyond the existing brand equity. For example, how much a certain channel, tactic, or overall campaign helped influence an increase in sales, newsletter sign-ups, etc.” (see Figure 1) Google’s answer confirms that incrementality is a thing in marketing analytics and not something that ChatGPT hallucinated.

Figure 1: The ideal way of measuring the incremental impact of a business action, e.g., a marketing campaign or a new game feature, on an outcome of interest, e.g., conversions or retention, is through a randomized control trial. Source: the author’s mind and hand (sorry if it’s not pretty).

Incrementality programs are so important in analytics because they aim to quantify the incremental causal effect that different actions, tactics and strategies had on relevant outcomes for the firm. Such precise causal measurement ensures that each action is attributed the right amount and sort of credit, in turn crucially informing the firm’s future actions and strategies. It can make all the difference between a fast approach to and increase in profitability. Or the inverse.

Now let’s see what we find about incrementality in game analytics:

ChatGPT: “In the context of game analytics, incrementality refers to measuring the incremental impact of a specific game feature, update, or intervention on player behavior, engagement, monetization, or other key performance indicators (KPIs). It aims to understand whether the implemented changes or additions have a positive effect on the game’s metrics beyond what would have occurred naturally without those modifications.”

Google: N/A, see Figure 2. Google is unable to answer the question, surfacing a link to a resource by the well-known company GameAnalytics that has nothing to do with incrementality. Then it offers material related to incrementality in marketing. Also Google Scholar has no clear leads.

In many ways, this tells us that –

  • Incrementality is not yet a concept of importance in game analytics;
  • It should be; due to its clear value proposition articulated above and due to ChatGPT’s plausible and succinct response. (I find ChatGPT very useful to check the plausibility and merit of new ideas in this way. The exercise is further helpful as ChatGPT commonly surfaces relevant definitions, references and related concepts.)

Based on these two points, this article aims to introduce the incrementality concept to game analytics. We will first define in more detail what incrementality means in the context of game analytics and then I will try to provide an overview of what I believe are important incrementality methods for game analytics and game analysts.

Figure 2: The concept of incrementality is foreign to game analytics as it stands. At a minimum, it has not been formally introduced — something that this blog post endeavors to change. Source: Google Search at www.google.com and scholar.google.com

Defining Incrementality in Game Analytics

While ChatGPT’s answer on incrementality in marketing analytics mentions a spectrum of methods that “aim to minimize biases and control for confounding variables, ensuring that the observed differences can be attributed to the marketing efforts with a reasonable degree of confidence,” its answer for incrementality in game analytics pretty squarely centers on A/B testing (experimentation):

Game developers and analysts often employ incrementality analysis to evaluate the effectiveness of specific game design choices, marketing campaigns, pricing strategies, or other initiatives. The goal is to isolate the impact of the intervention by comparing the behavior of two groups: a test group that experiences the new feature or change and a control group that does not.

Typically, the test group consists of players who have been exposed to the modified game element, while the control group comprises players who continue to experience the game in its original state. By analyzing the differences in player behavior and performance between these two groups, game developers can assess the incremental impact of the introduced changes.

It further writes that “insights gained from incrementality analysis in game analytics can help developers make data-driven decisions to optimize game design, improve player engagement, enhance monetization strategies, and refine the overall player experience. By understanding the true impact of specific game elements or changes, developers can focus their efforts on features and updates that lead to measurable improvements in game metrics and player satisfaction.”

Leaning into these elaborations, let’s define incrementality in game analytics:

Def. Incrementality in game analytics: The measurement of the incremental impact of specific game design choices or features, marketing campaigns, pricing strategies, technical updates, or other interventions on player behavior, engagement, monetization, or other key performance indicators (KPIs) of a game or game portfolio. Incrementality efforts aim to understand whether the implemented changes or additions have a positive effect on the game’s metrics beyond what would have occurred without those modifications. It thereby employs various methods of causal inference that help minimize biases and control for confounding variables, ensuring that the observed differences can be attributed to the intervention in question with a quantifiable degree of confidence.

This definition heavily draws on ChatGPT’s output but extends the space of admissible methods considerably beyond AB testing and experimentation. Incrementality methods in game analytics need to, as they do in marketing analytics, encompass all that causal inference has to offer! A further addendum to the definition is the quantification of uncertainty to help analysts, designers and product managers decide which measurements to rely on and which ones to assess further or abandon.

(For completeness, I should mention that, during my online search, I found this blog post titled “Incremental Data Science for Mobile Game Development.” The title is promising, and the covered applications are actually well selected and outlined, but the post fails to deliver a definition or even touch on the subject again. There is no further mention of incrementality or related concepts like experimentation, AB testing, causal inference, randomization. I am unclear what the author intended, but as it stands, the post’s content and title are simply disjointed.)

The Game Analytics Incrementality Matrix

There is a plethora of analytical tools available for incrementality measurement. Figure 3 tries to provide an initial overview positioning the different tools on a two-dimensional matrix. The horizontal dimension addresses the degree of intervention necessary to use a specific incrementality technique. E.g., AB testing requires randomly exposing different treatments (e.g., versions of the game) to different users, so a high degree of intervention in the user experience. Propensity score matching or marketing mix modeling (MMM) on the other hand work from observational data, requiring no or almost no dedicated intervention and leveraging naturally occurring variation in exposure. Note that not requiring intervention is of course an advantage, but non-interventional methods also tend to be less precise and flexible in detecting incrementality.

The second vertical axis covers the spectrum from low-level product to high-level market touchpoints with users. At higher-level market touchpoints such as an ad platform or (Connected-)TV, a game developer clearly has less control over a user’s experience and in fact might not be able to act at the user-level at all instead deciding on spend level and strategy for a specific marketing channel.

Figure 3: The Game Analytics Incrementality Matrix, showing different tools for incrementality measurement in game analytics. The horizontal axis depicts the degree of needed intervention in the user experience and the vertical axis the proximity to market versus product. A serious game analytics effort should entail the underlined methods at a minimum.

Per the matrix shown in Figure 3, AB testing becomes less applicable as you move further away from high levels of control over a user’s experience at granular product touchpoints to low levels of control, e.g., on an ad platform. Here, the applicability of AB testing as a tool for incrementality measurement will be dependent on the ad platform and if it offers AB test-based measurement. Similarly, algorithmic personalization becomes less applicable the less you can control the user experience at the individual-level. It can get analytically involved with reinforcement learning approaches like bandits and is also usually technically costly to implement. AB testing and algorithmic personalization overlap as a simple form of the latter can involve estimating linear models with interaction terms (of the sort outcome ~ treatment + treatment*covariate) on the data of a randomized (control) trial or AB test. All of these approach leverage the idea of treatment effect heterogeneity, i.e., that the incrementality effect of an intervention (read: marketing campaign, game feature) will often be different for different users where differences are captured and measured in the observed covariates about users.

So far, we discussed methods of “interventional causal inference,” i.e., where we need to intervene to produce the data we need to perform incrementality measurement. We will now turn to observational causal inference, i.e., methods that operate from naturally occurring data without explicit intervention on our part. Difference-in-difference and synthetic control estimators thereby try to identify effects of an event of interest from differences over time. E.g., should you release a new game feature to different countries at different points in time, these methods could produce an estimate of the feature’s incremental effect on your players from this data. They can do so both in the realm of low-level product and higher-level market touchpoints. Synthetic control methods work a bit better with availability of granular data, hence why they don’t reach as far up into the market territory. As both methods benefit from a certain level of intervention, they reach into the right half (the intervention territory) of the chart.

Regression discontinuity leverages the fact that experience assignment can be arbitrary within narrow bounds of certain user characteristics. E.g., say, players need a score of 10,000 to get access to a specific feature. Regression discontinuity would then estimate the feature’s incremental effect between players that reached a score of 9,999, and didn’t get access to the feature, and players that reached a score of 10,000, and got access to the feature. The idea is that these players must be very similar other than missing one point out of 10,000. Likewise, matching methods aim to compare instances who are as similar as possible, but some were exposed to the treatment of interest, and some were not. They essentially aim to control selection effects by matching up instances based on available non-endogenous covariates.

Again, I urge you to note that non-interventional incrementality methods are great because they work from naturally occurring data, but they also are limited in their precision and flexibility. True experiments, randomized control trials, are the gold standard for incrementality measurement and causal inference. Whenever implementable at acceptable cost, they should be your incrementality method of choice. In many cases you however cannot intervene in an environment or system and non-interventional methods are your only shot at incrementality measurement. E.g., when Apple changes its appstore ranking algorithm, you cannot run an experiment to determine what impact this had on organic adoption of your apps — but you can use difference-in-difference style estimators to try and quantify the effect.

Marketing Mix Modeling in the M(atr)ix?

Now, you may be surprised to see marketing and media mix modeling in a figure about incrementality measurement in game analytics. Let me elaborate.

This class of methods was originally developed to produce estimates of the elasticity of sales in advertising on different channels and media from aggregate (high-level) observational data. That is why it is positioned at the opposite end of AB testing in Figure 3. It, however, can take different actions in a firm’s marketing mix into account, including pricing, promotion and major product changes. When a model comprehensively covers a firm’s action space across the marketing mix (the 4P: product, price, place, promotion), it is commonly called marketing mix model (MMM).

You may notice that, while MMM was conceived for estimation from aggregate observational market data, its area in Figure 3reaches into the product territory — that is because a comprehensive MMM can include measures for major product changes (the first of the 4P of the marketing mix) and produce estimates of the incremental effect of these changes on sales and other outcomes. The MMM area further reaches into the territory of interventional causal inference. This is because modern MMM implementations commonly can be calibrated using the precise incrementality measurement outputs from ad experiments.

A simple MMM can boil down to a linear regression of sales on ad spend across different channels plus some trends for competition and indicators for holidays and other key events. Which is a rather simple analytics approach. But a reliable, well-calibrated, and trusted MMM can take a lot of effort in data preparation, model estimation, and on the organizational level, e.g., to be well integrated into a company’s marketing analytics operations.

Finally, Figure 3 shows multi-touch attribution (MTA). MTA provides estimates of the fractional contribution of customers’ touchpoints with a company’s marketing efforts. To the extent that a product (=game) produces touchpoints with new customers (think word-of-mouth), its area reaches into product territory. MTA models draw on many different methods, ranging from MMM-style to game theoretic approaches such as Shapley values which is why it overlaps with other methods. Complementarities between MTA models and MMM can be particularly high, e.g., reflected in Nielsen’s definition of MTA: “[MTA] is a marketing effectiveness measurement technique that takes all of the touchpoints on the consumer journey into consideration and assigns fractional credit to each so that a marketer can see how much influence each channel has on a sale.”

TL;DR / Why Does This Matter for Game Development?

I said in the beginning of this article that incrementality programs are so important in analytics because they ensure that each action taken by a team is attributed the right amount and sort of credit. This exercise is crucially important for the team to know what design and marketing choices worked and which ones didn’t, which ones your players liked and which ones they didn’t (see Figure 1), to in turn inform future actions and strategies. Getting this right can make all the difference between building an awesome game that players love and a game that is no fun and struggles with player retention and engagement.

Leaning into the incrementality concept in marketing analytics, this article defines incrementality for game analytics and provides an initial overview of methods (Figure 3), structured along the dimensions of needed intervention in users’ experience and proximity to product versus market. The second dimension in turn influences the granularity of the available data.

Game analytics can benefit from a formal introduction of the concept of incrementality: Game design, management (e.g., live operations), and marketing need to work in complementarity, as a team, to ensure success for a game. Principled and rigorous incrementality measurement processes and tools can quantify the location and extent of these complementarities and direct the symphony of everyone coming together to build an amazing game.

A serious game analytics effort should entail the underlined methods in Figure 3 at a minimum: AB testing / experimentation, simple forms of algorithmic personalization, and marketing mix modeling. Especially, MMM-style methods may currently be underleveraged in game analytics. They can not only provide guidance for marketing efforts but also inform larger product, live operations, and marketing initiatives, especially in conjunction with a strong and well-defined experimentation roadmap.

Reach out if you want to know how and morejulian.runge@gamedatapros.com

 Like our blog? Join our substack.

Employment Application

    Resume Upload:
    (Allowed file types: pdf, doc, rtf)

    Cover Letter Upload:
    (Allowed file types: pdf, doc, rtf)